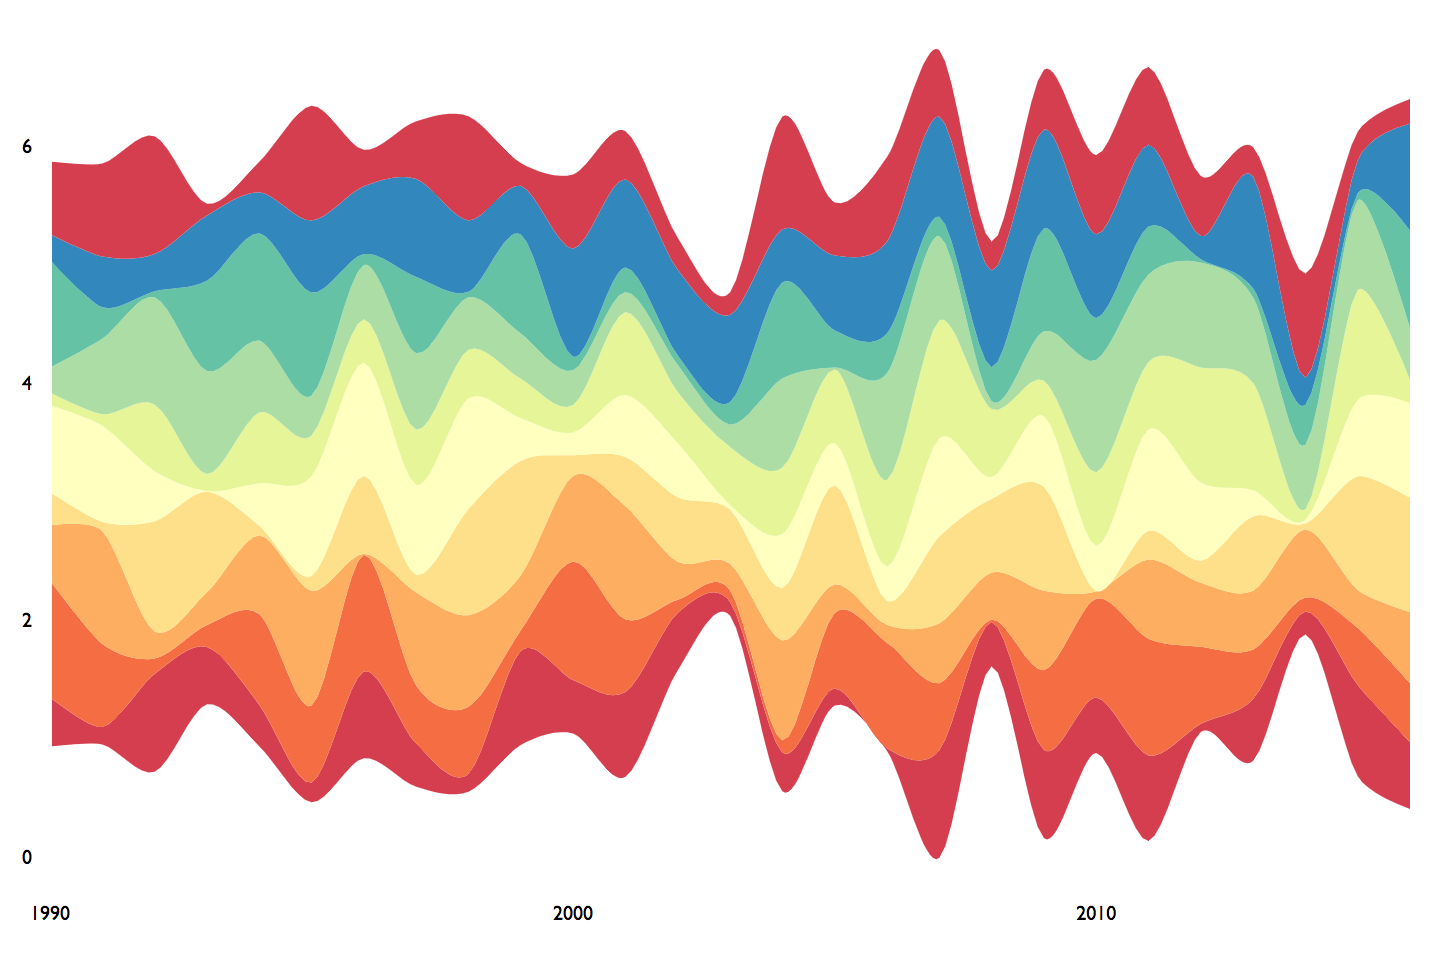
In R, streamgraphs are built thanks to the streamgraph package that is an htmlwidget. They are thus rendered as interactive graphics.
It is possible to get a static version, using the interactive=FALSE option.
It is however tricky to export the html format to an usual .png image. You have to use the webshot library which allows to take screenshots of web page from R. Check the commented code below to see how to proceed:

# Library
library(streamgraph)
# Create data:
data <- data.frame(
  year=rep(seq(1990,2016) , each=10),
  name=rep(letters[1:10] , 27),
  value=sample( seq(0,1,0.0001) , 270)
)
# Start with a classic stream graph. It is supposed to open in a browser
streamgraph(data, key="name", value="value", date="year")
# Copy the URL of the html window you get
# load webshot library
library(webshot)

#install phantom:
webshot::install_phantomjs()
# Make a webshot in pdf : high quality but can not choose printed zone
webshot("paste_your_html_here.html" , "output.pdf", delay = 0.2)

# Make a webshot in png : Low quality - but you can choose shape
webshot("paste_your_html_here" , "output.png", delay = 0.2 , cliprect = c(440, 0, 1000, 10))


