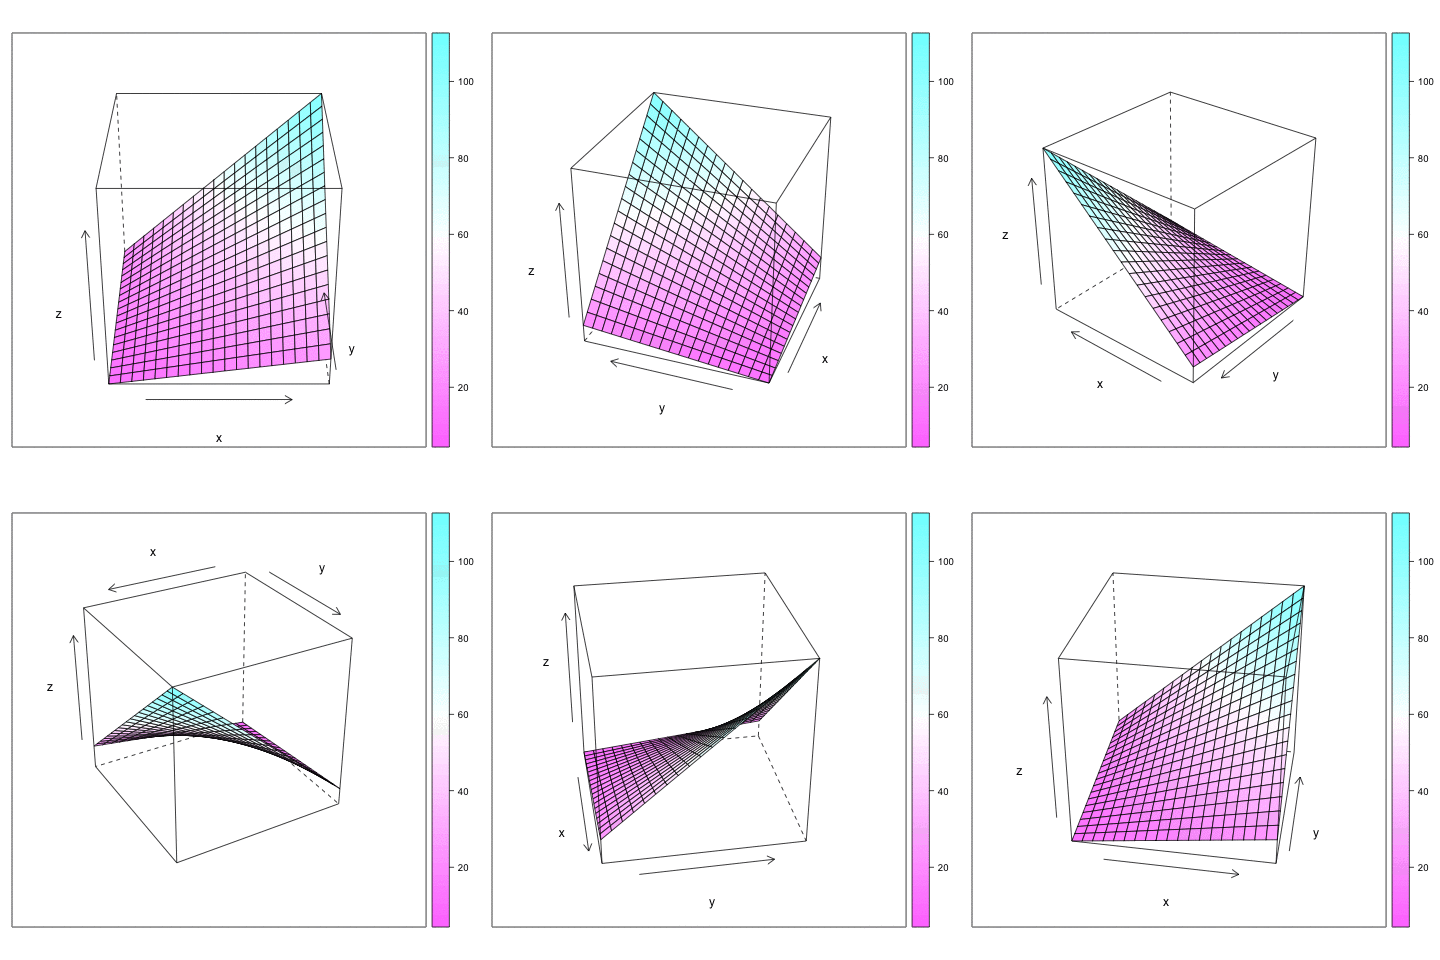
This chart follows the previous
basic animation
with R and Image Magick. It uses those two
tools to make an animated 3d chart. The
process is:
- Start by building 10 images with
R - Use Image magick to concatenate them in a
gif
Of course, Image Magick must be installed on your computer. See here to install it.
Note: : This example has been found on Mark Heckmann’s R you ready website.

# Library for 3D
library(lattice)

# Initiate data
b0 <- 10
b1 <- .5
b2 <- .3
int12 <- .2
g <- expand.grid(x = 1:20, y = 1:20)
g$z <- b0 + b1*g$x + b2*g$y + int12*g$x*g$y

# Make several .png images
png(file="example%03d.png", width=480, heigh=480)
for (i in seq(0, 350 ,10)){
    print(wireframe(z ~ x * y, data = g,
              screen = list(z = i, x = -60),
              drape=TRUE))
  }
dev.off()

# convert pdf to gif using ImageMagick
system("convert -delay 40 *.png animated_3D_plot.gif")

# cleaning up
file.remove(list.files(pattern=".png"))


