Default ggplot2 background
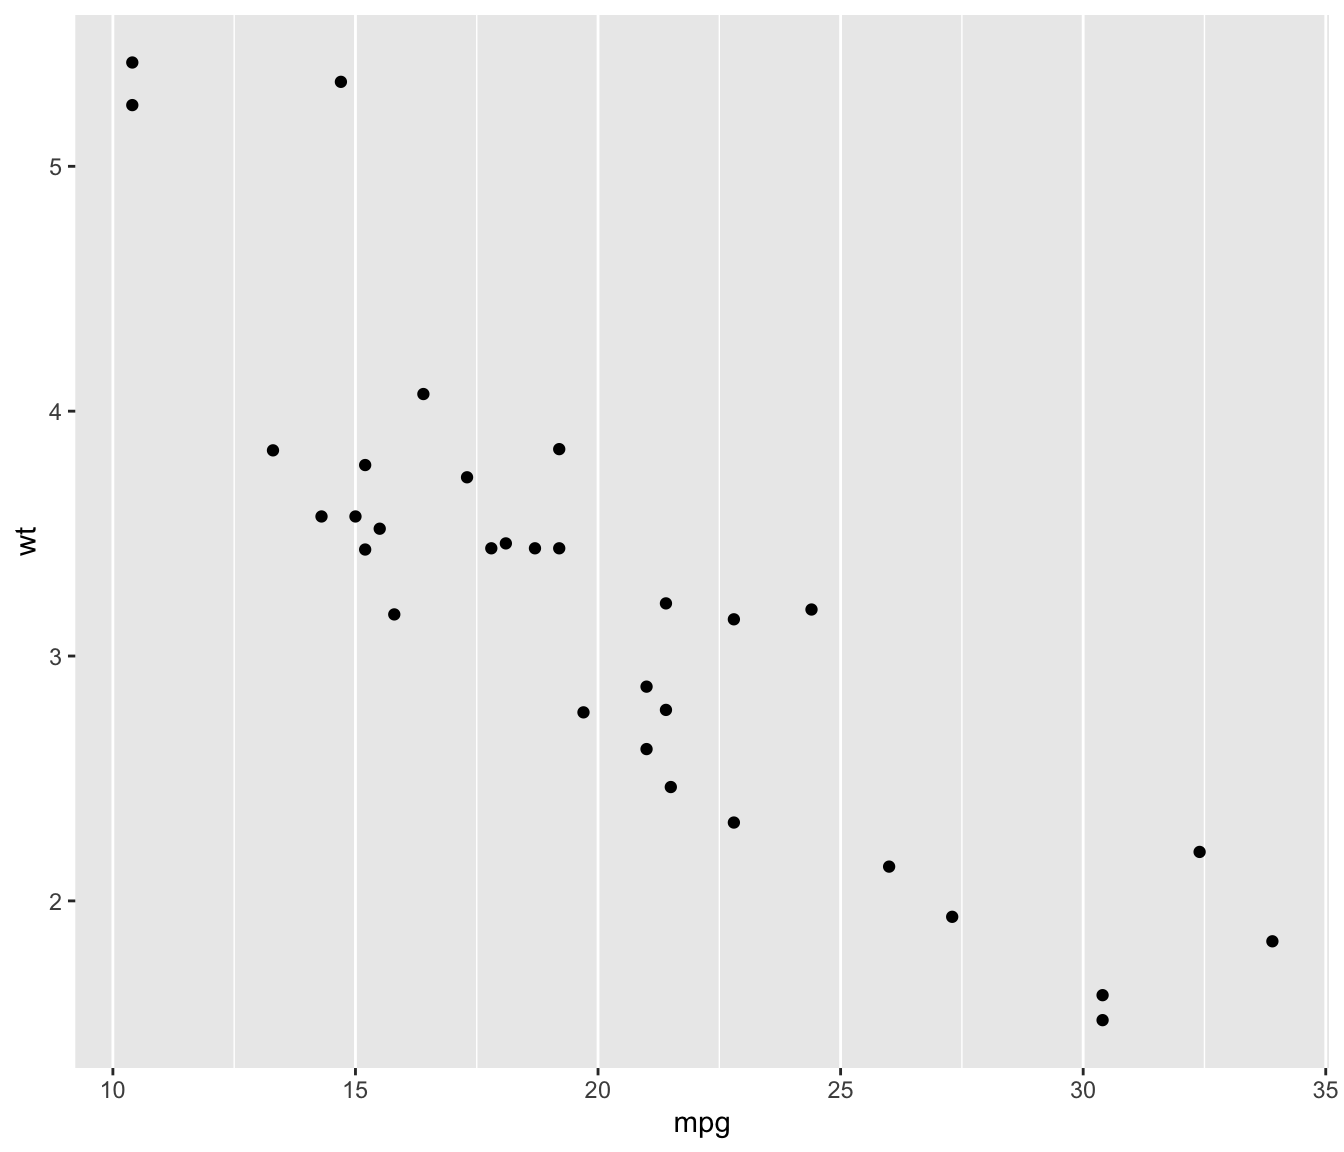
Let’s start with a very basic ggplot2
scatterplot. By default,
ggplot2 offers a grey background with white major and
minor gridlines.
It is possible to change that thanks to the
theme() function. Keep reading to learn how!

# Load ggplot2
library(ggplot2)

# Very basic chart
basic <- ggplot( mtcars , aes(x=mpg, y=wt)) +
  geom_point()
basic
Background color: plot.background and
panel.background
Two options of the theme() functions are available to
control the map background color.
plot_background controls the color of the whole chart.
panel.background controls the part between the axis.
Both are rectangles, their features is thus specified through an
element_rect() function.

basic + theme(
    plot.background = element_rect(fill = "green"),
    panel.background = element_rect(fill = "red", colour="blue")
    )
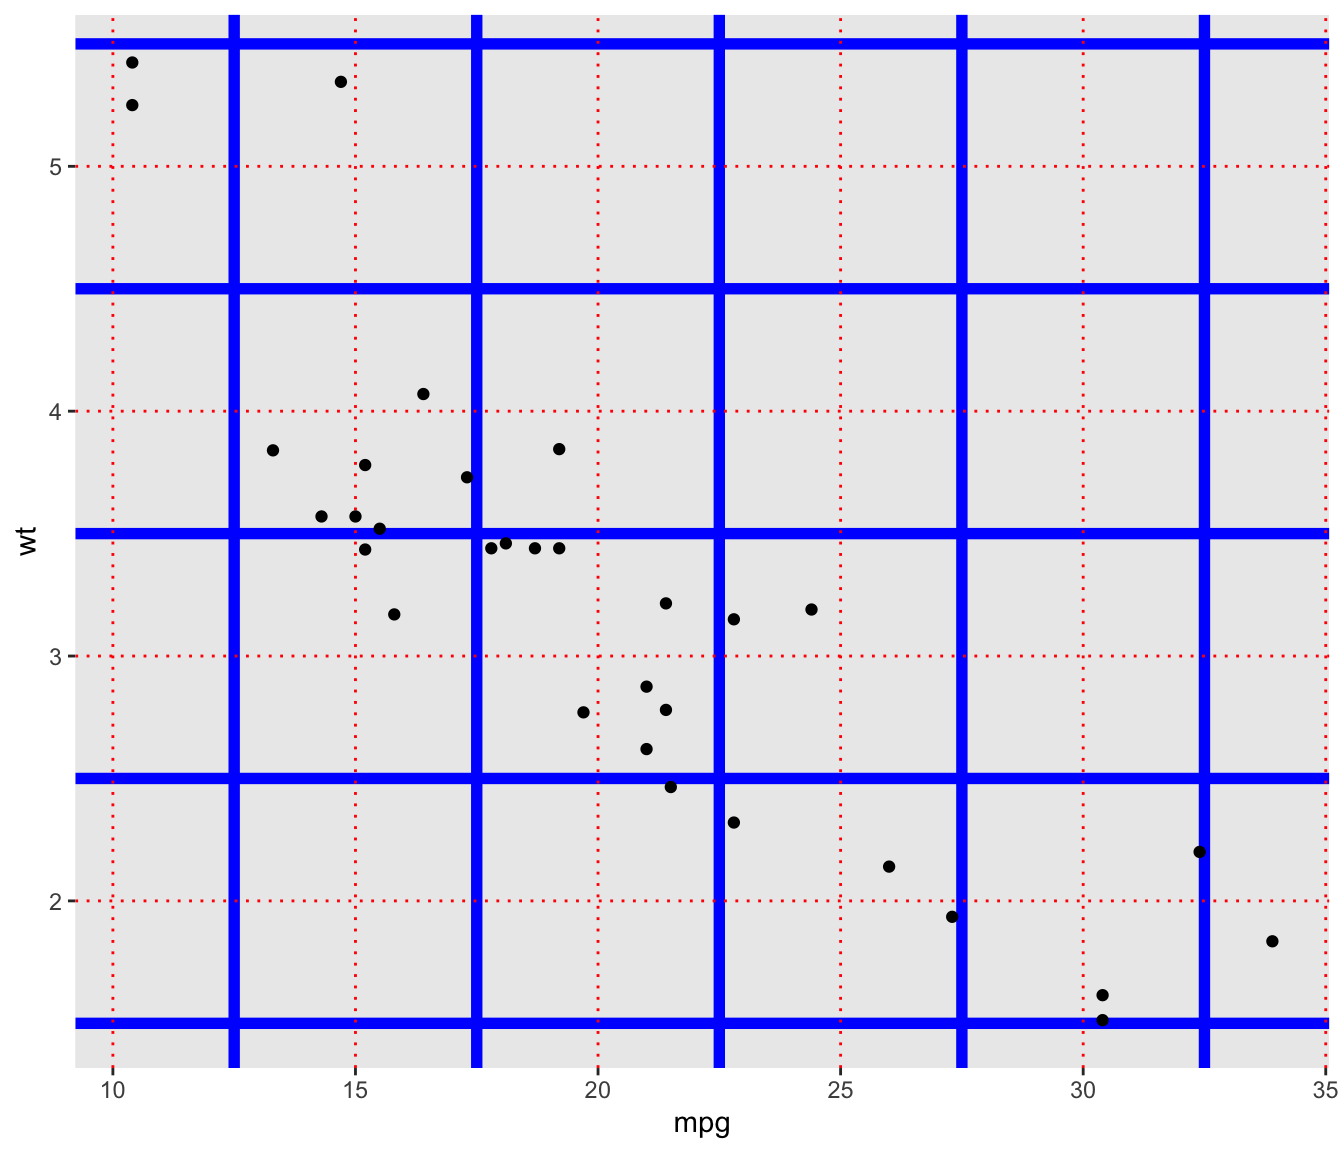
Customize the grid: panel.grid.major and
panel.grid.minor


Two main types of grid exist with ggplot2: major and minor.
They are controled thanks to the panel.grid.major and
panel.grid.minor options.
Once more, you can add the options .y or .x at
the end of the function name to control one orientation only.
Features are wrapped in an element_line() function.
Specifying element_blanck() will simply removing the grid.


