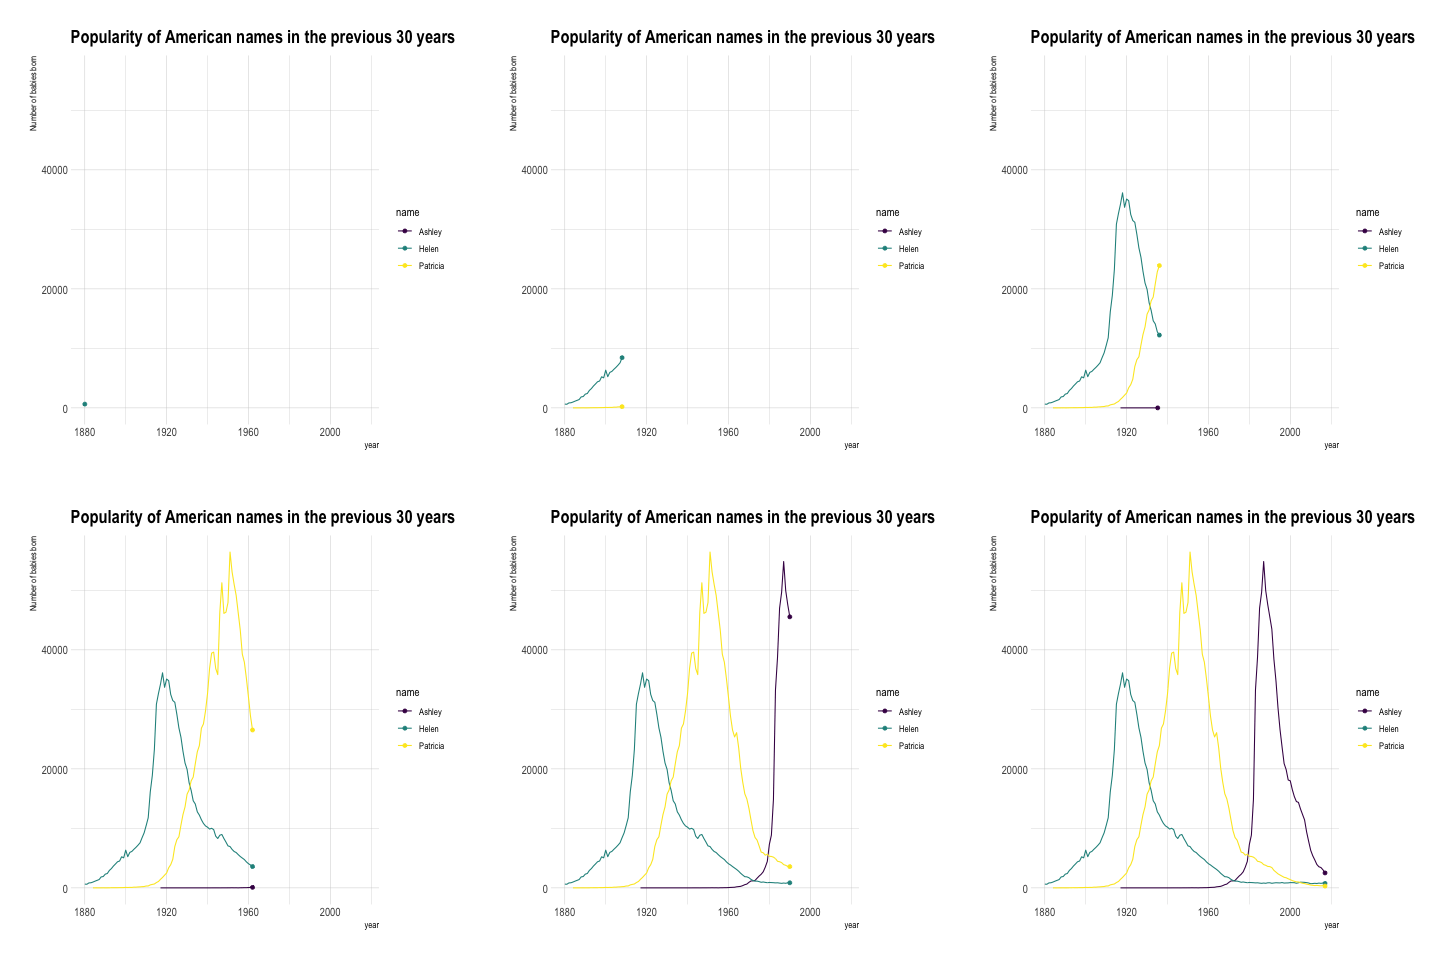
Progressive line chart rendering
Before trying to build an animated plot
with gganimate, make sure you understood how to build a
line chart with R and
ggplot2.
The idea is to add an additional aesthetics called
transition_..() that provides a frame variable. For
each value of the variable, a step on the chart will be drawn. Here,
transition_reveal() is used to reveal each new time
frame progressively.
Note that the gganimate automatically performs a
transition between state.

# libraries:
library(ggplot2)
library(gganimate)
library(babynames)
library(hrbrthemes)

# Keep only 3 names
don <- babynames %>%
  filter(name %in% c("Ashley", "Patricia", "Helen")) %>%
  filter(sex=="F")

# Plot
don %>%
  ggplot( aes(x=year, y=n, group=name, color=name)) +
    geom_line() +
    geom_point() +
    scale_color_viridis(discrete = TRUE) +
    ggtitle("Popularity of American names in the previous 30 years") +
    theme_ipsum() +
    ylab("Number of babies born") +
    transition_reveal(year)


# Save at gif:
anim_save("287-smooth-animation-with-tweenr.gif")


