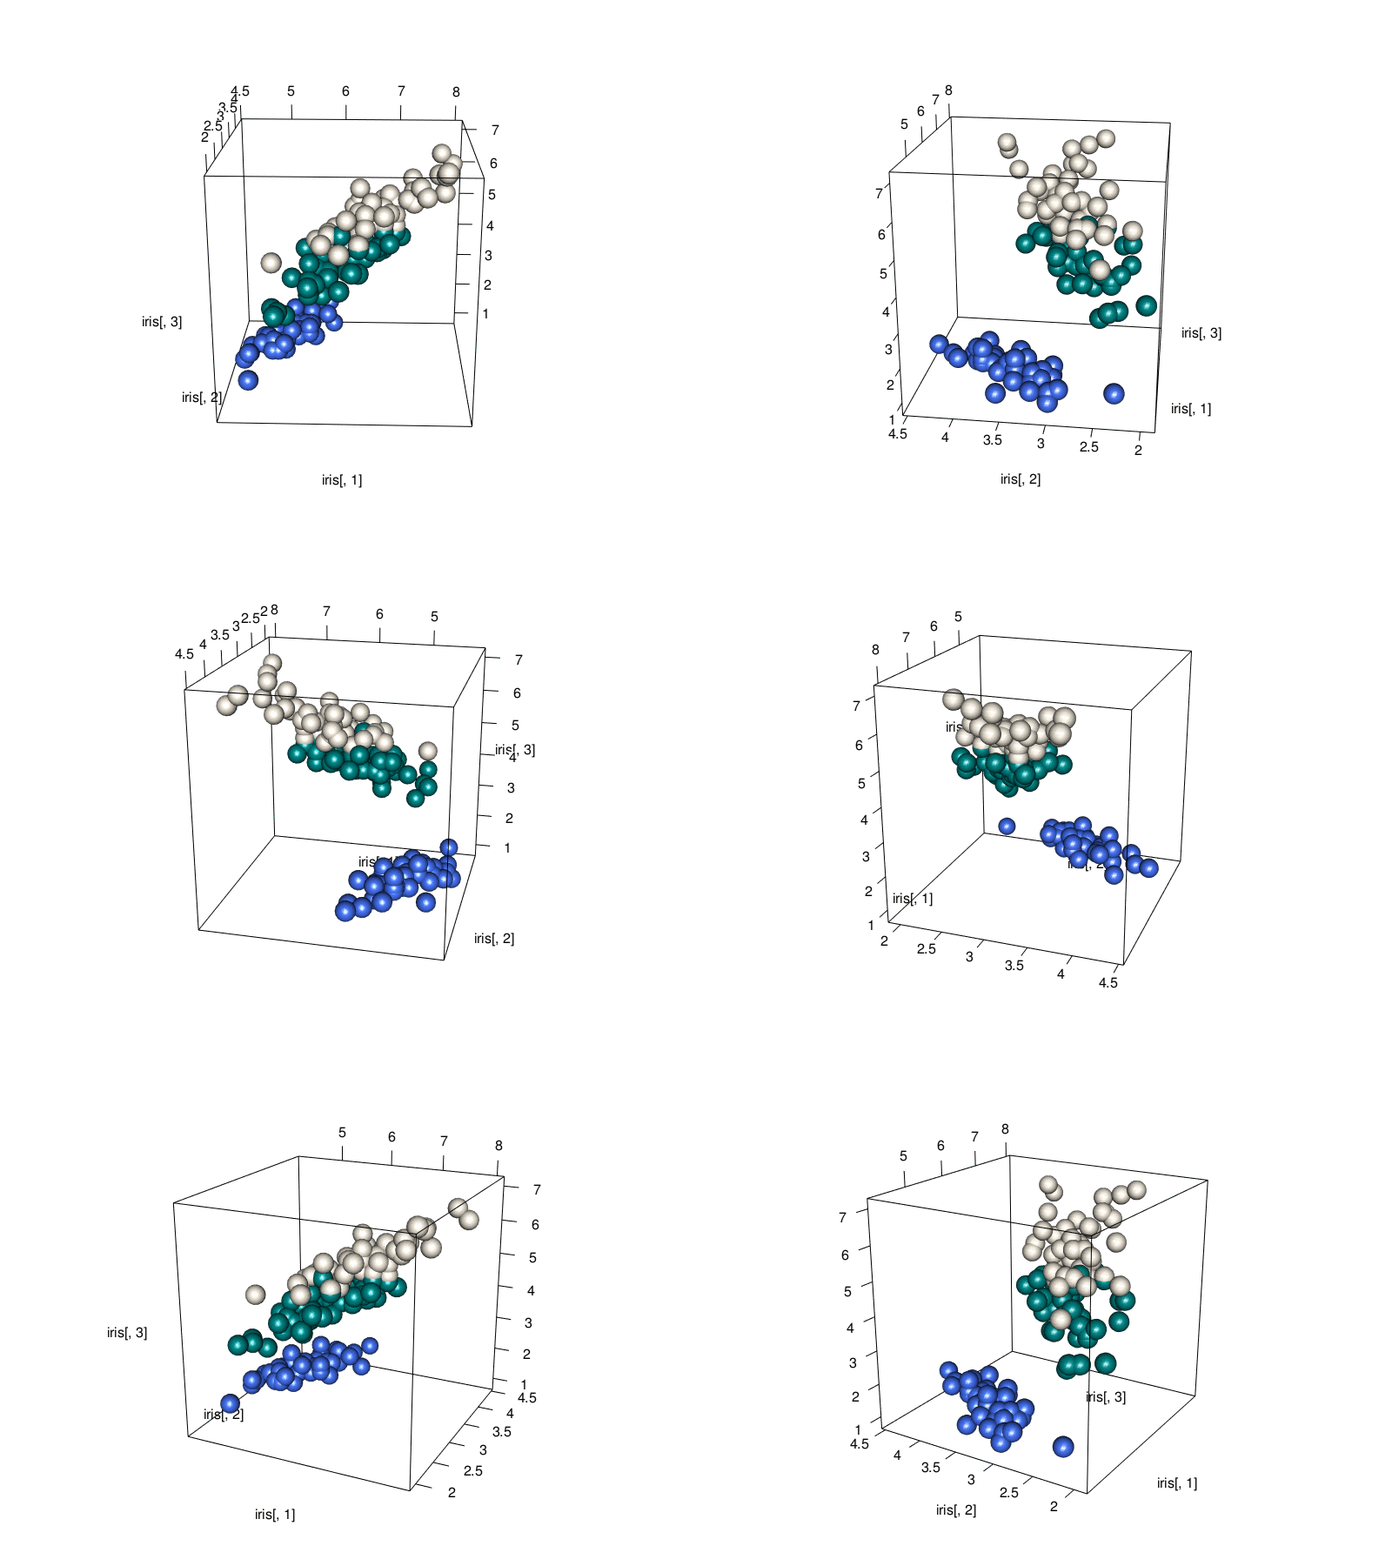
The rgl package is the best option to build 3d charts in R. Please see this post for an introduction to 3d scatterplots using it.
It also provides the plot3d() and play3d() functions that allow to animate the 3d chart, and eventually to export the result at a .gif format. Here is an application to the famous iris dataset, with a nice animated 3d scatterplot chart.

library( rgl )
library(magick)

# Let's use the iris dataset
# iris

# This is ugly
colors <- c("royalblue1", "darkcyan", "oldlace")
iris$color <- colors[ as.numeric( as.factor(iris$Species) ) ]

# Static chart
plot3d( iris[,1], iris[,2], iris[,3], col = iris$color, type = "s", radius = .2 )

# We can indicate the axis and the rotation velocity
play3d( spin3d( axis = c(0, 0, 1), rpm = 20), duration = 10 )

# Save like gif
movie3d(
  movie="3dAnimatedScatterplot",
  spin3d( axis = c(0, 0, 1), rpm = 7),
  duration = 10,
  dir = "~/Desktop",
  type = "gif",
  clean = TRUE
)


