Plot climate stripes graph for a station.
Usage
climatestripes_station(
  station,
  start = 1950,
  end = 2020,
  with_labels = "yes",
  verbose = FALSE,
  ...
)
Arguments
- station
Character string with station identifier code(s) (see
aemet_stations()).- start
Numeric value as start year (format:
YYYY).- end
Numeric value as end year (format:
YYYY).- with_labels
Character string as yes/no. Indicates whether to use labels for the graph or not.
- verbose
Logical
TRUE/FALSE. Provides information about the flow of information between the client and server.- ...
Arguments passed on to
ggstripesn_tempNumeric value as the number of colors of the palette. (default
11).col_palCharacter string indicating the name of the
hcl.pals()color palette to be used for plotting.
Value
A ggplot2 object
API Key
You need to set your API Key globally using aemet_api_key().
See also
Other aemet_plots:
climatogram_normal(),
climatogram_period(),
ggclimat_walter_lieth(),
ggstripes(),
ggwindrose(),
windrose_days(),
windrose_period()
Other stripes:
climaemet_9434_temp,
ggstripes()
Examples
# \donttest{
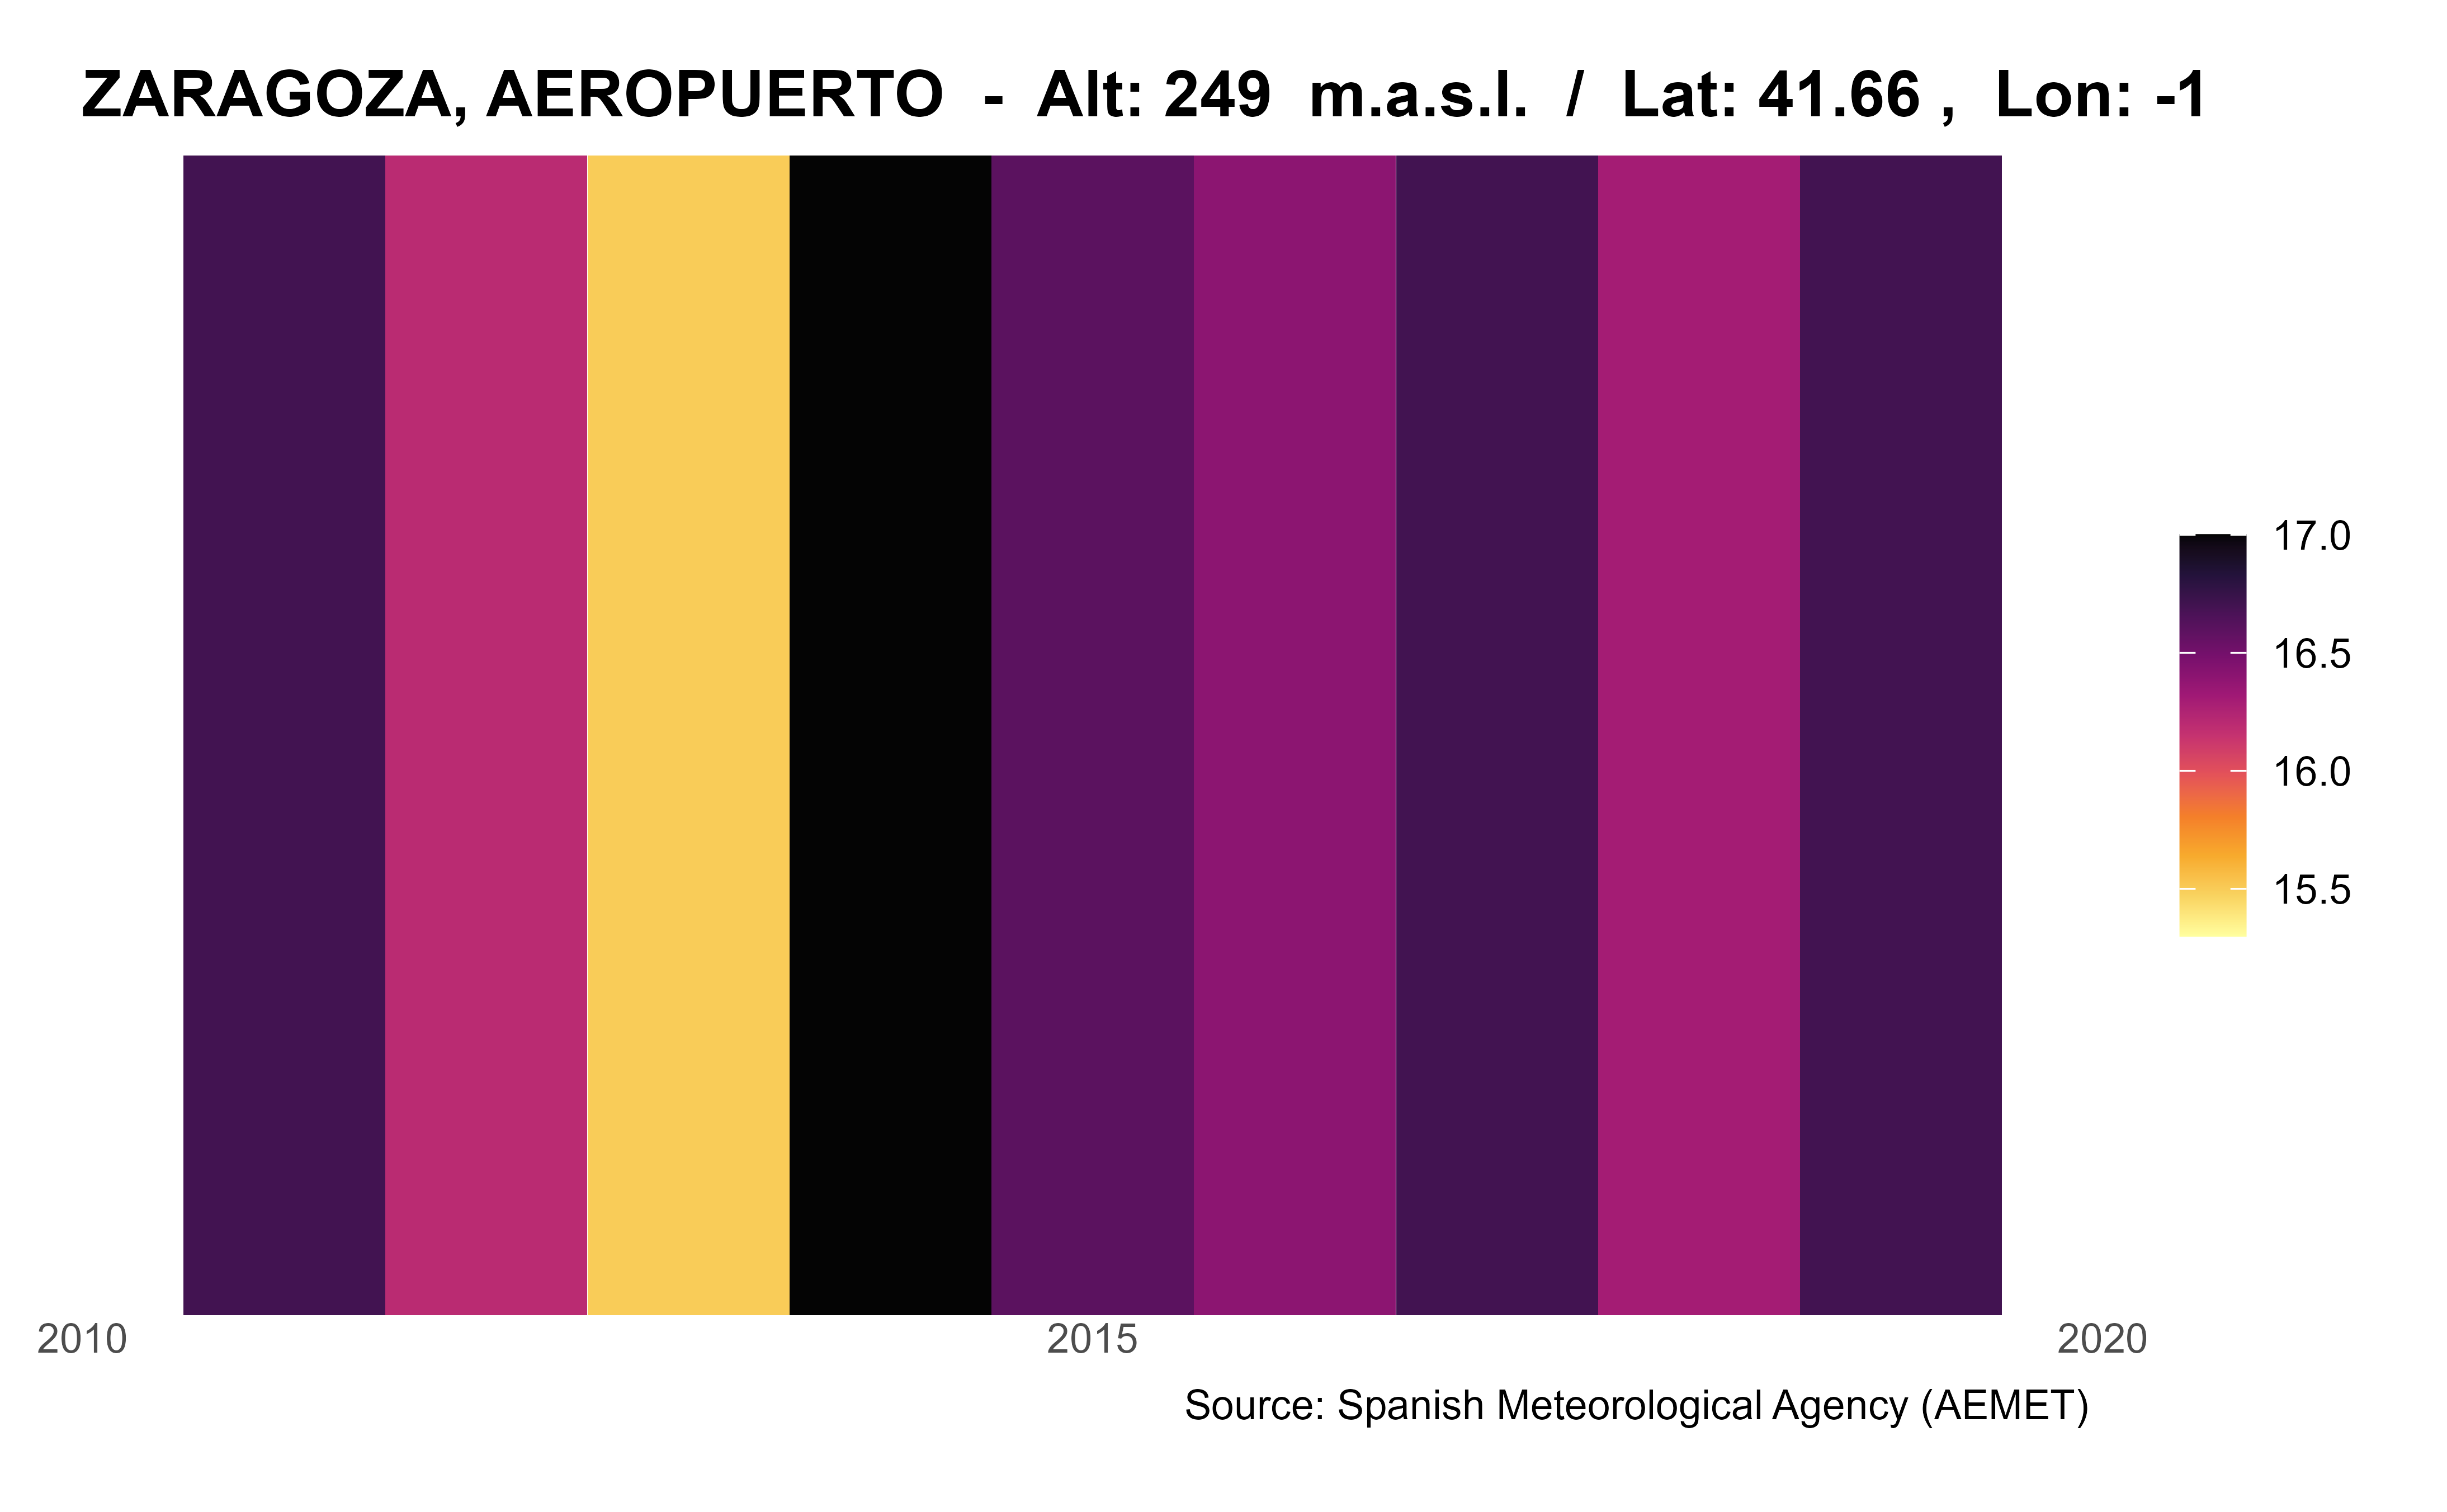
climatestripes_station(
"9434",
start = 2010,
end = 2020,
with_labels = "yes",
col_pal = "Inferno"
)
#> Data download may take a few minutes ... please wait
#> Climate stripes plotting ...
#> Warning: Removed 2 rows containing missing values or values outside the scale range
#> (`geom_tile()`).
 # }
# }