Venn Diagram


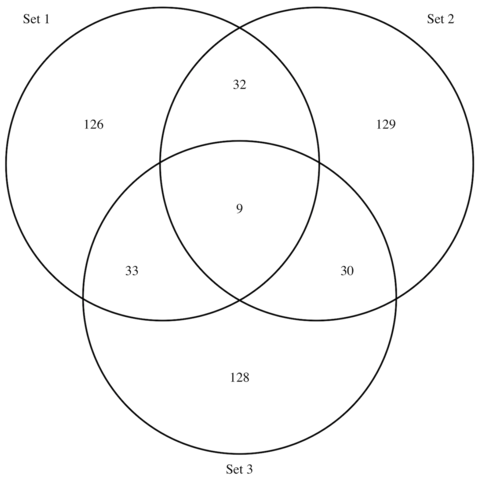
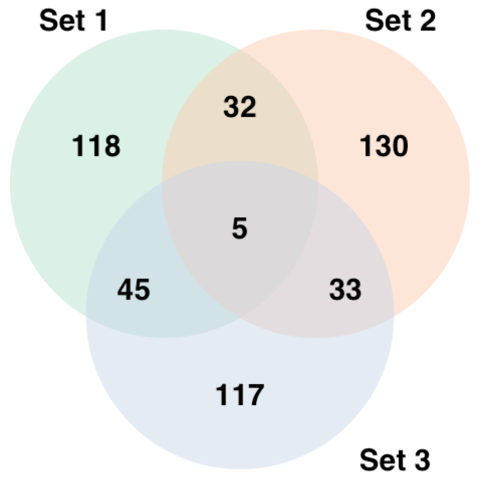
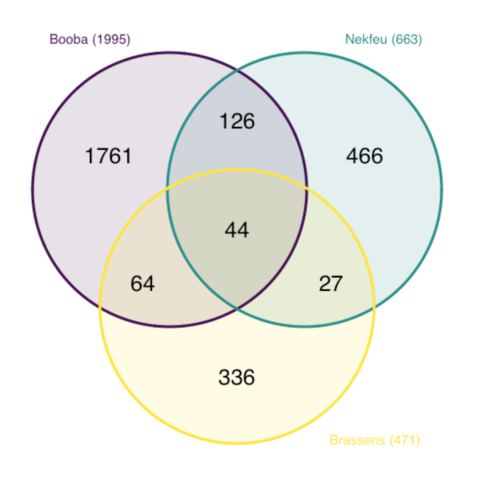
A Venn diagram (also called primary diagram, set diagram or logic diagram) is a diagram that shows all possible logical relations between a finite collection of different sets. In R, the VennDiagram package is the best option to build one. Note that with more than 3 sets, it is better to switch to an upsetChart, as described below.

Step by step - the VennDiagram package

The VennDiagram package is the best way to build Venn Diagrams in R. The 3 examples below will guide you through its functioning, from basic examples to customized charts.


Switch to the upsetChart with UpSetR

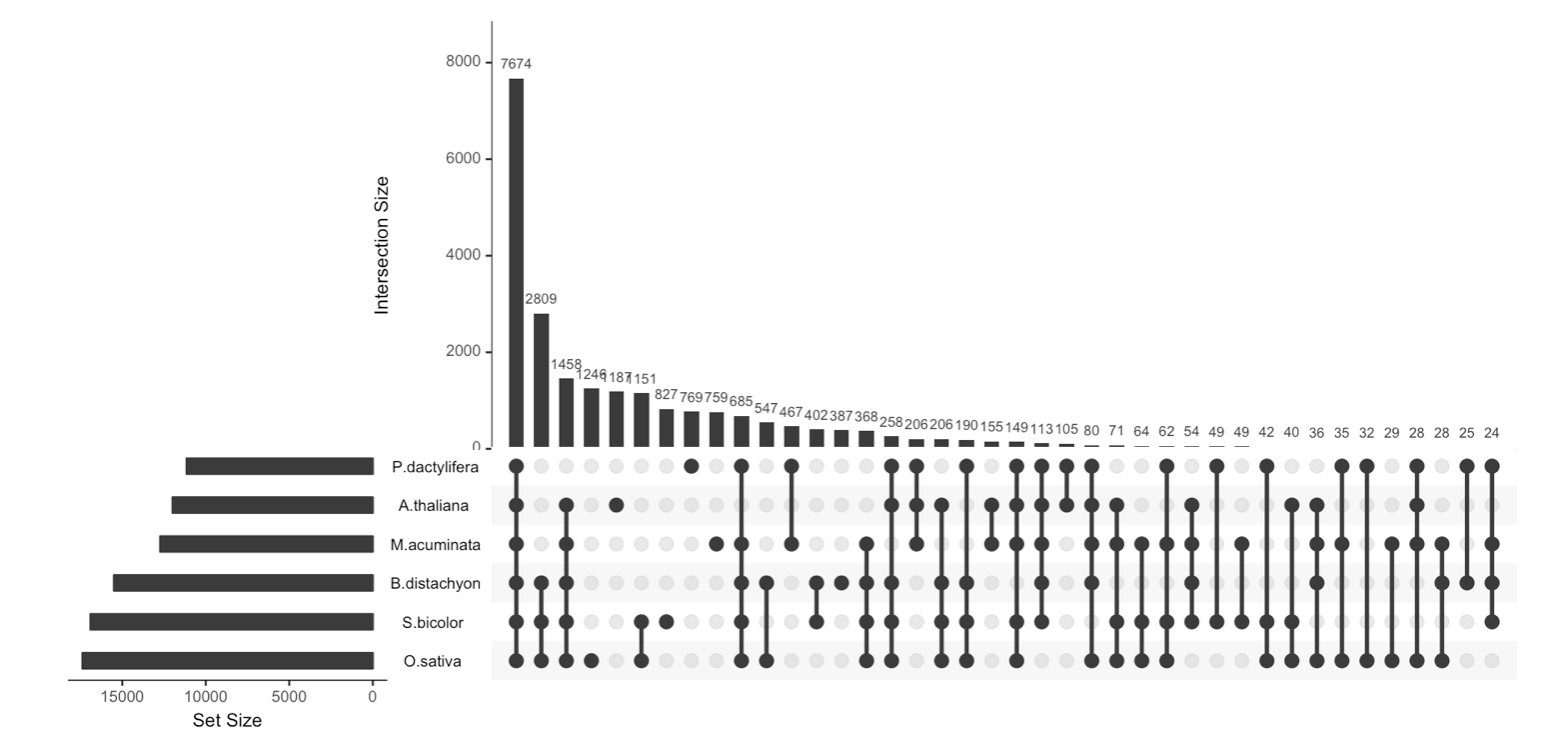
An Upset plot is an alternative to the Venn Diagram used to deal with more than 3 sets. Indeed, a classic Venn Diagram gets to cluttered and unreadable with four groups or more. The upSet plot is built in R thanks to the upSetR package.
Show code More explanations

Related chart types


Treemap
Doughnut
Pie chart
Dendrogram
Circular packing