
About the project


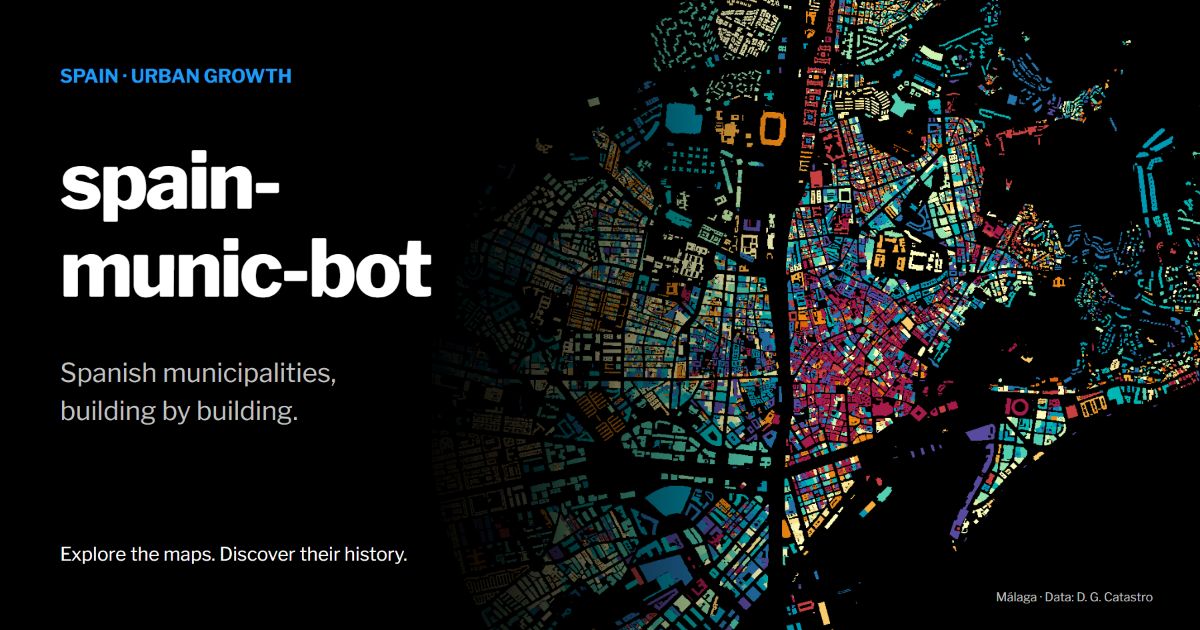
This project generated maps of buildings in Spanish municipalities, inspired by Dominic Royé’s urban-growth visualizations. Automated posting is currently disabled. The last public output record is dated May 17, 2022.
Buildings
Example: buildings in Málaga grouped by construction period.

Project journey

Browse the generated-map records.
R packages
Core packages used in the project are:
- CatastRo for the buildings.
- mapSpain for the location of the municipalities.
- ggplot2 for plotting.
- rtweet for posting.
Other packages include sf, dplyr and supporting tools.
The project uses renv to record its R package dependencies. External data services and publishing APIs may have changed since the maps were generated.
Credits
-
Based on
-
Automation:
- GitHub Actions based on \@espinielli’s GitHub Repo.
-
Sources:
Original execution workflow
The original entry point is shown below. It invokes the map-generation and Twitter publishing code. Review its configuration, dependencies and API credentials before running it. The command can publish posts.
$ Rscript R/trigger.R
The entry point attempts to run R/01_create_map.R three times per invocation. Each successful run can publish a map and update the local log.