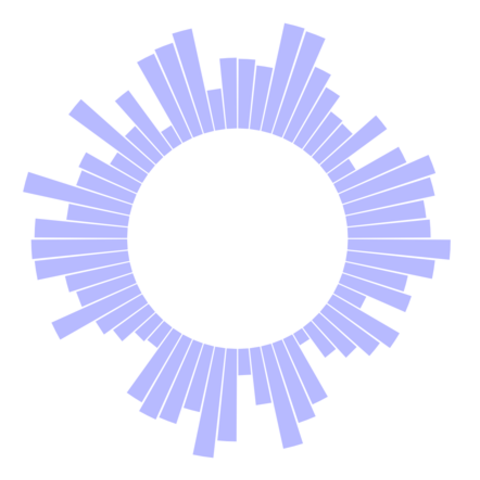
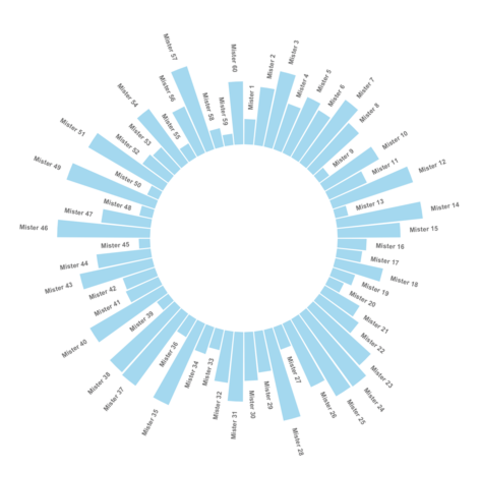
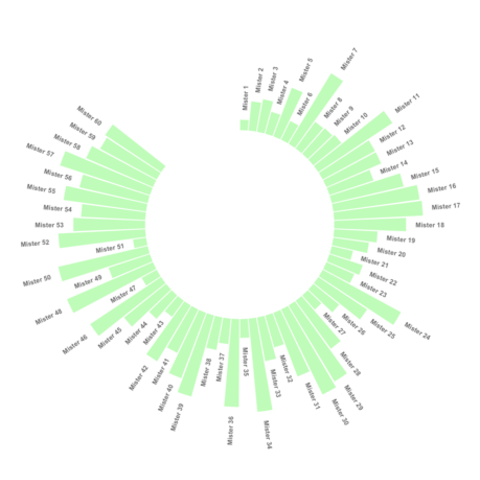
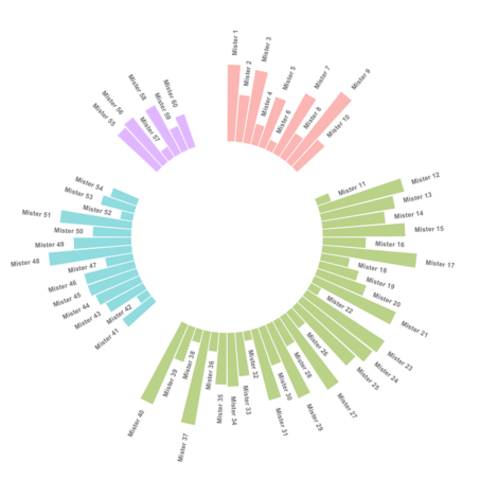
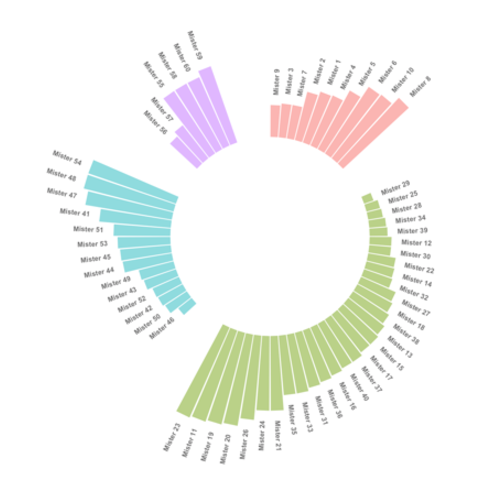
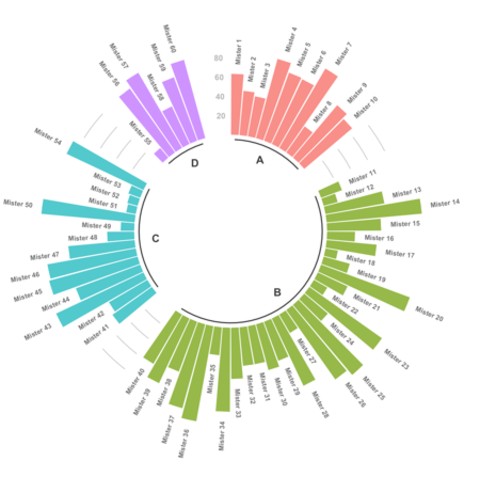
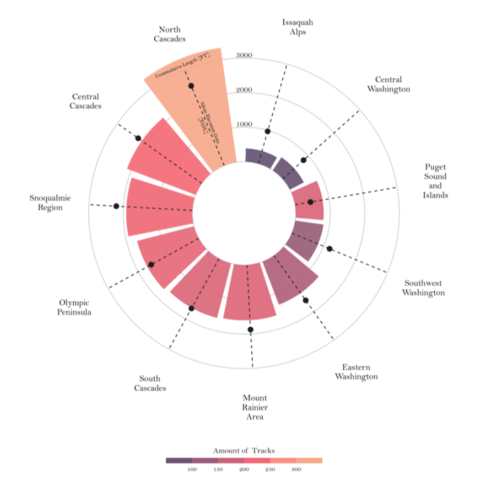
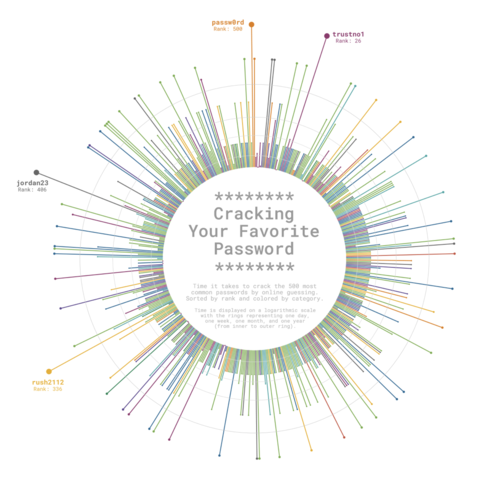
Here is a set of examples leading to a proper circular barplot, step by step. The first most basic circular barchart shows how to use
coord_polar() to make the barchart circular. Next examples describe the next steps to get a proper figure: gap between groups, labels and customization.
Now that all the basic concepts of circularity have been described, it is possible to build a highly customized circular stacked barchart.
Code
