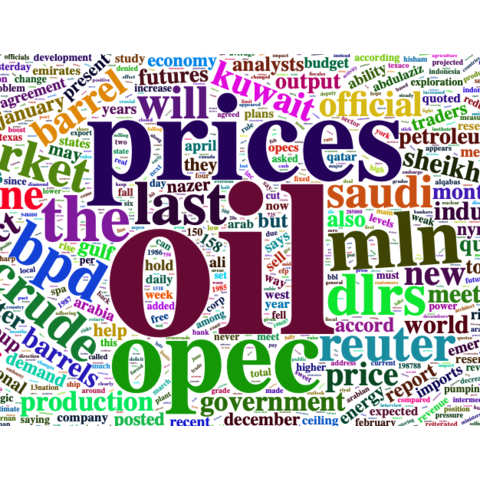
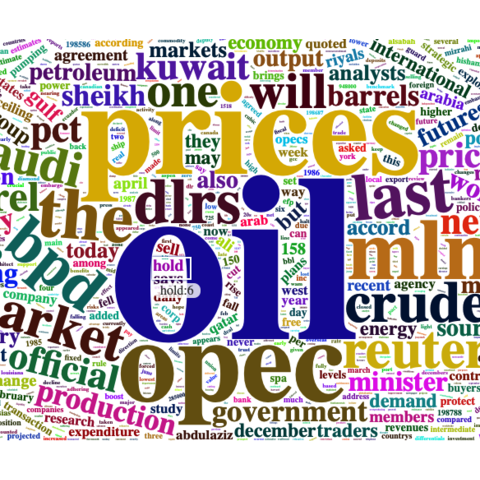
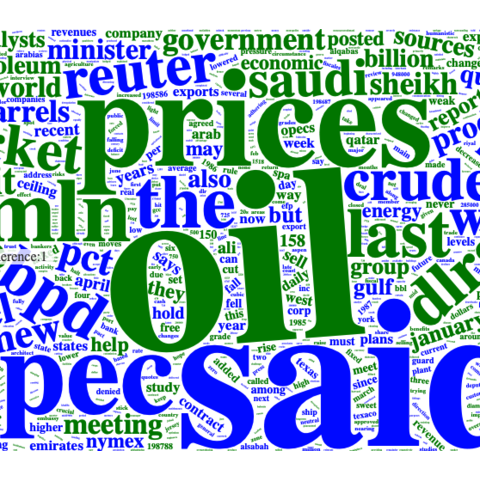
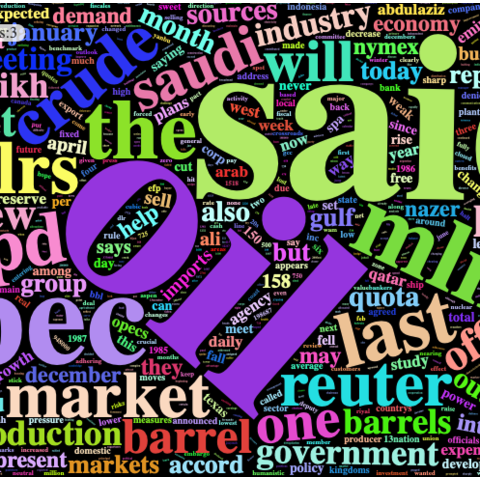
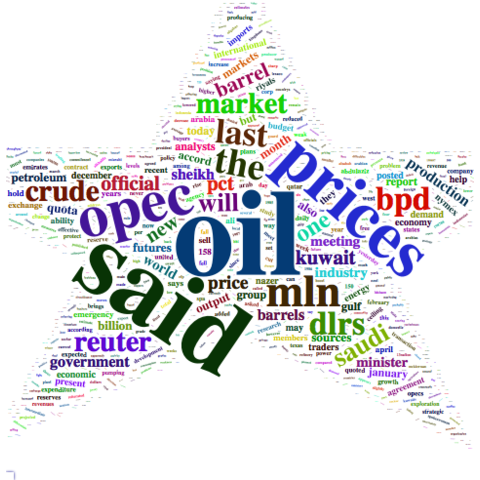
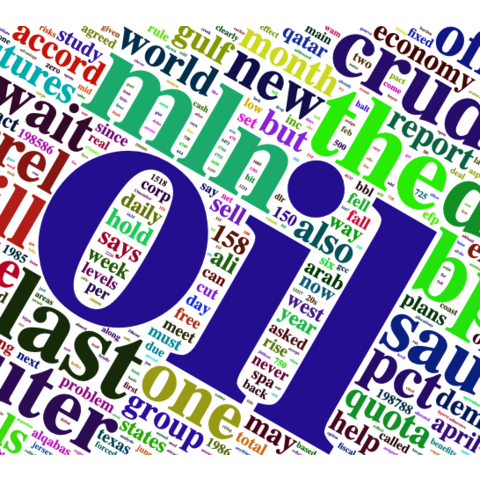
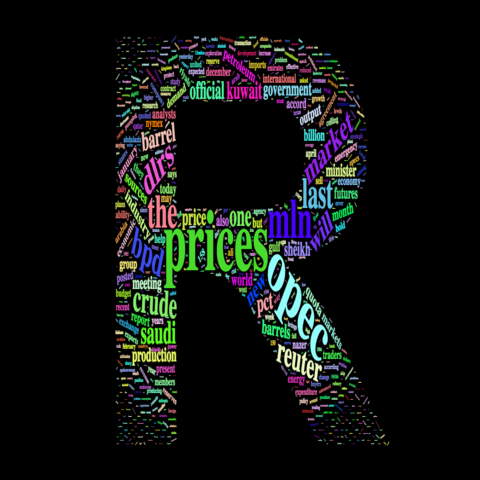
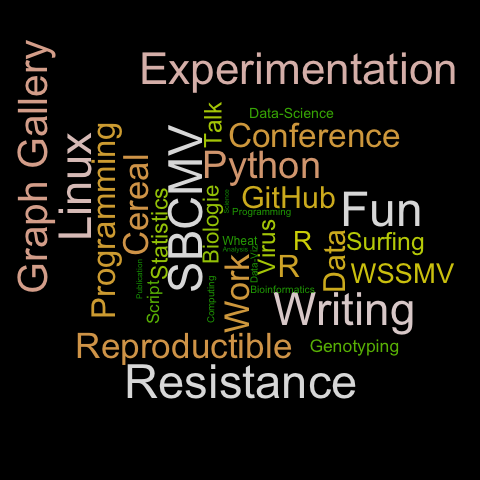
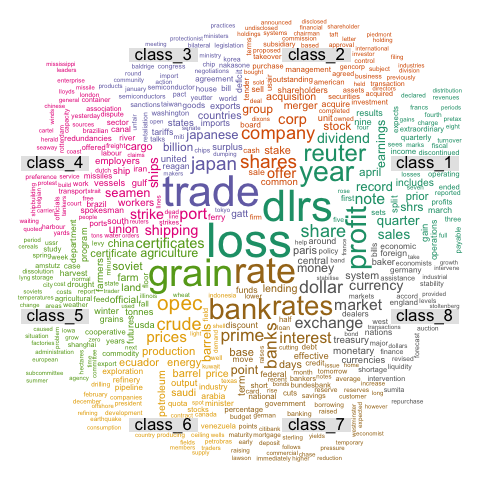
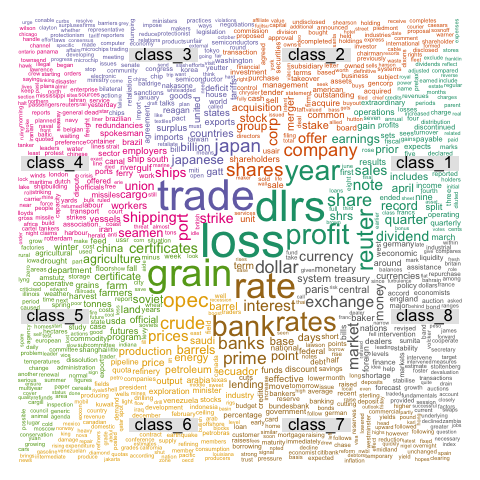
Wordcloud2
The
Wordcloud2
package by Chiffon Lang is
probably the best way to build
wordclouds
with R. Note that it is a html widget. Thus the default output format
is HTML. If you need a PNG or
PDF, read
this post.
Wordclouds are useful for quickly perceiving the most prominent terms. they are widely used in media and well understood by the public. However, they are criticized for 2 main reasons:
- Area is a poor metaphor of a numeric value, it is hardly perceive by the human eye
- Longer words appear bigger by construction
To put it in a nutshell, wordclouds must be avoided. You can read more about that in data-to-viz. Why not considering a lollipop plot or a barplot instead?
Wordcloud
The wordcloud package is another way to build wordclouds
in R. It does not allow as much customization as
wordcloud2, but is easy to use and output the chart more
easily to PNG or PDF.
