Skip to contents

On CRAN

Download counts for my packages on CRAN.

Historical downloads

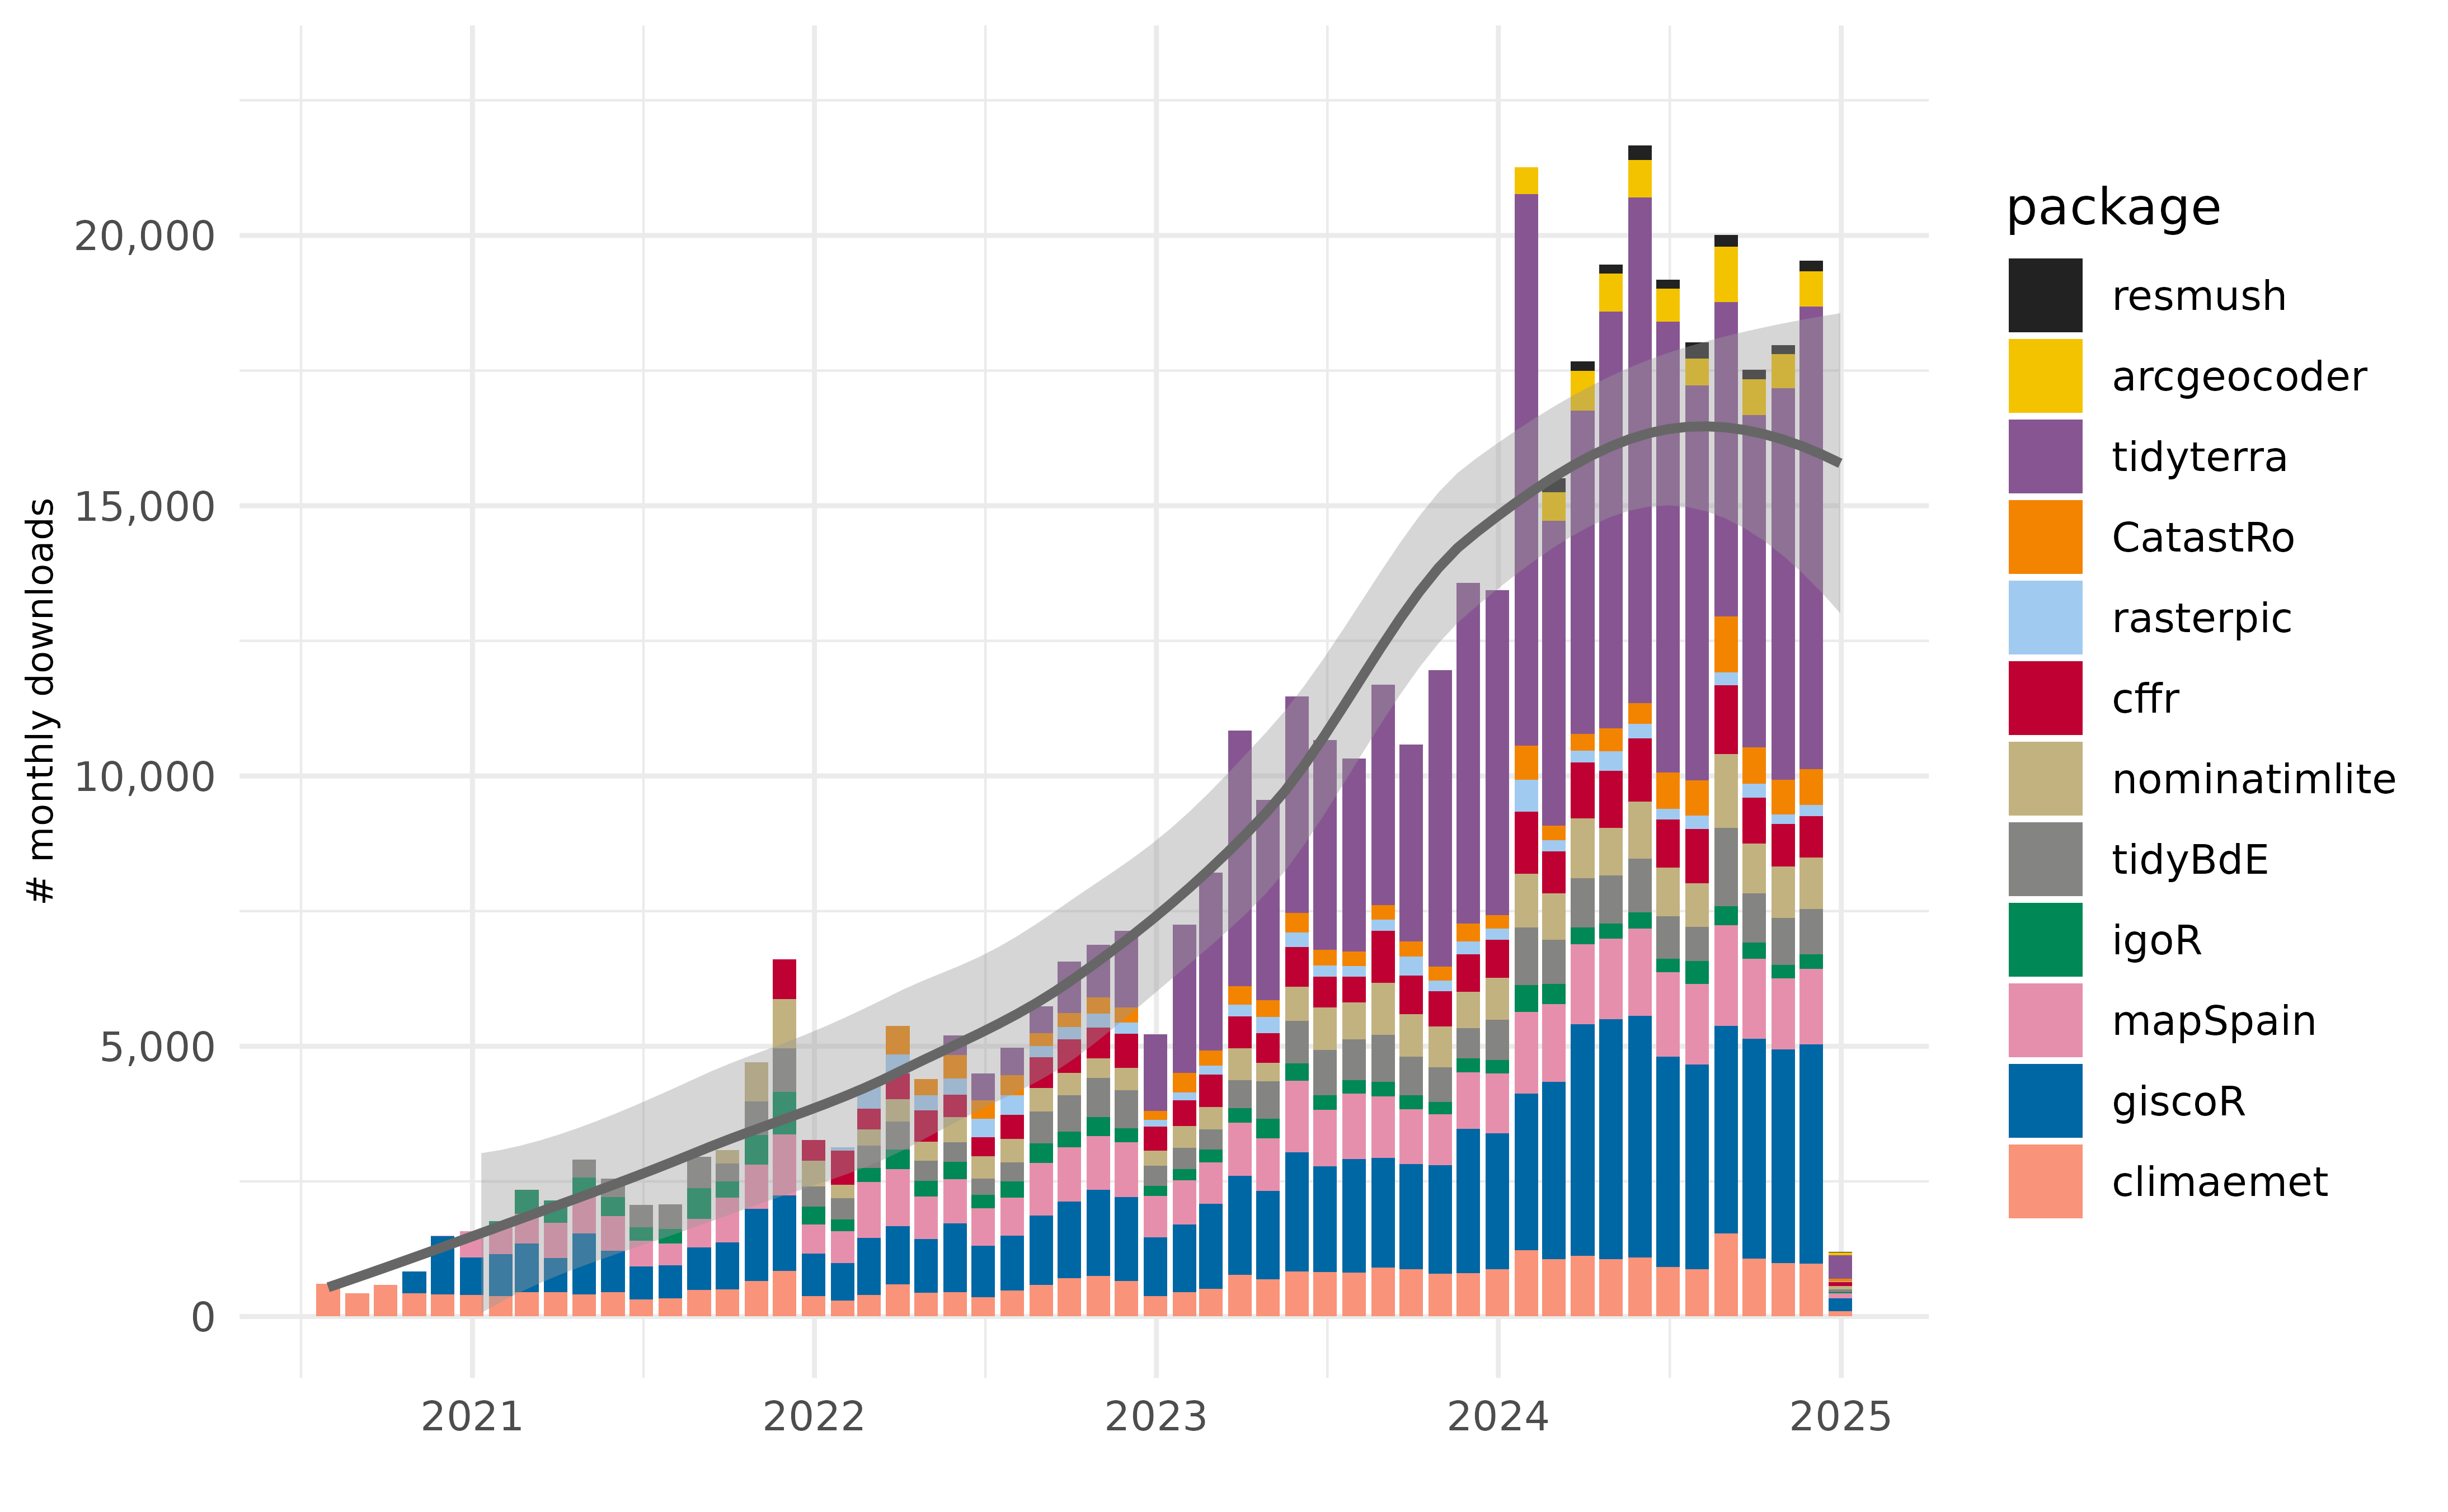
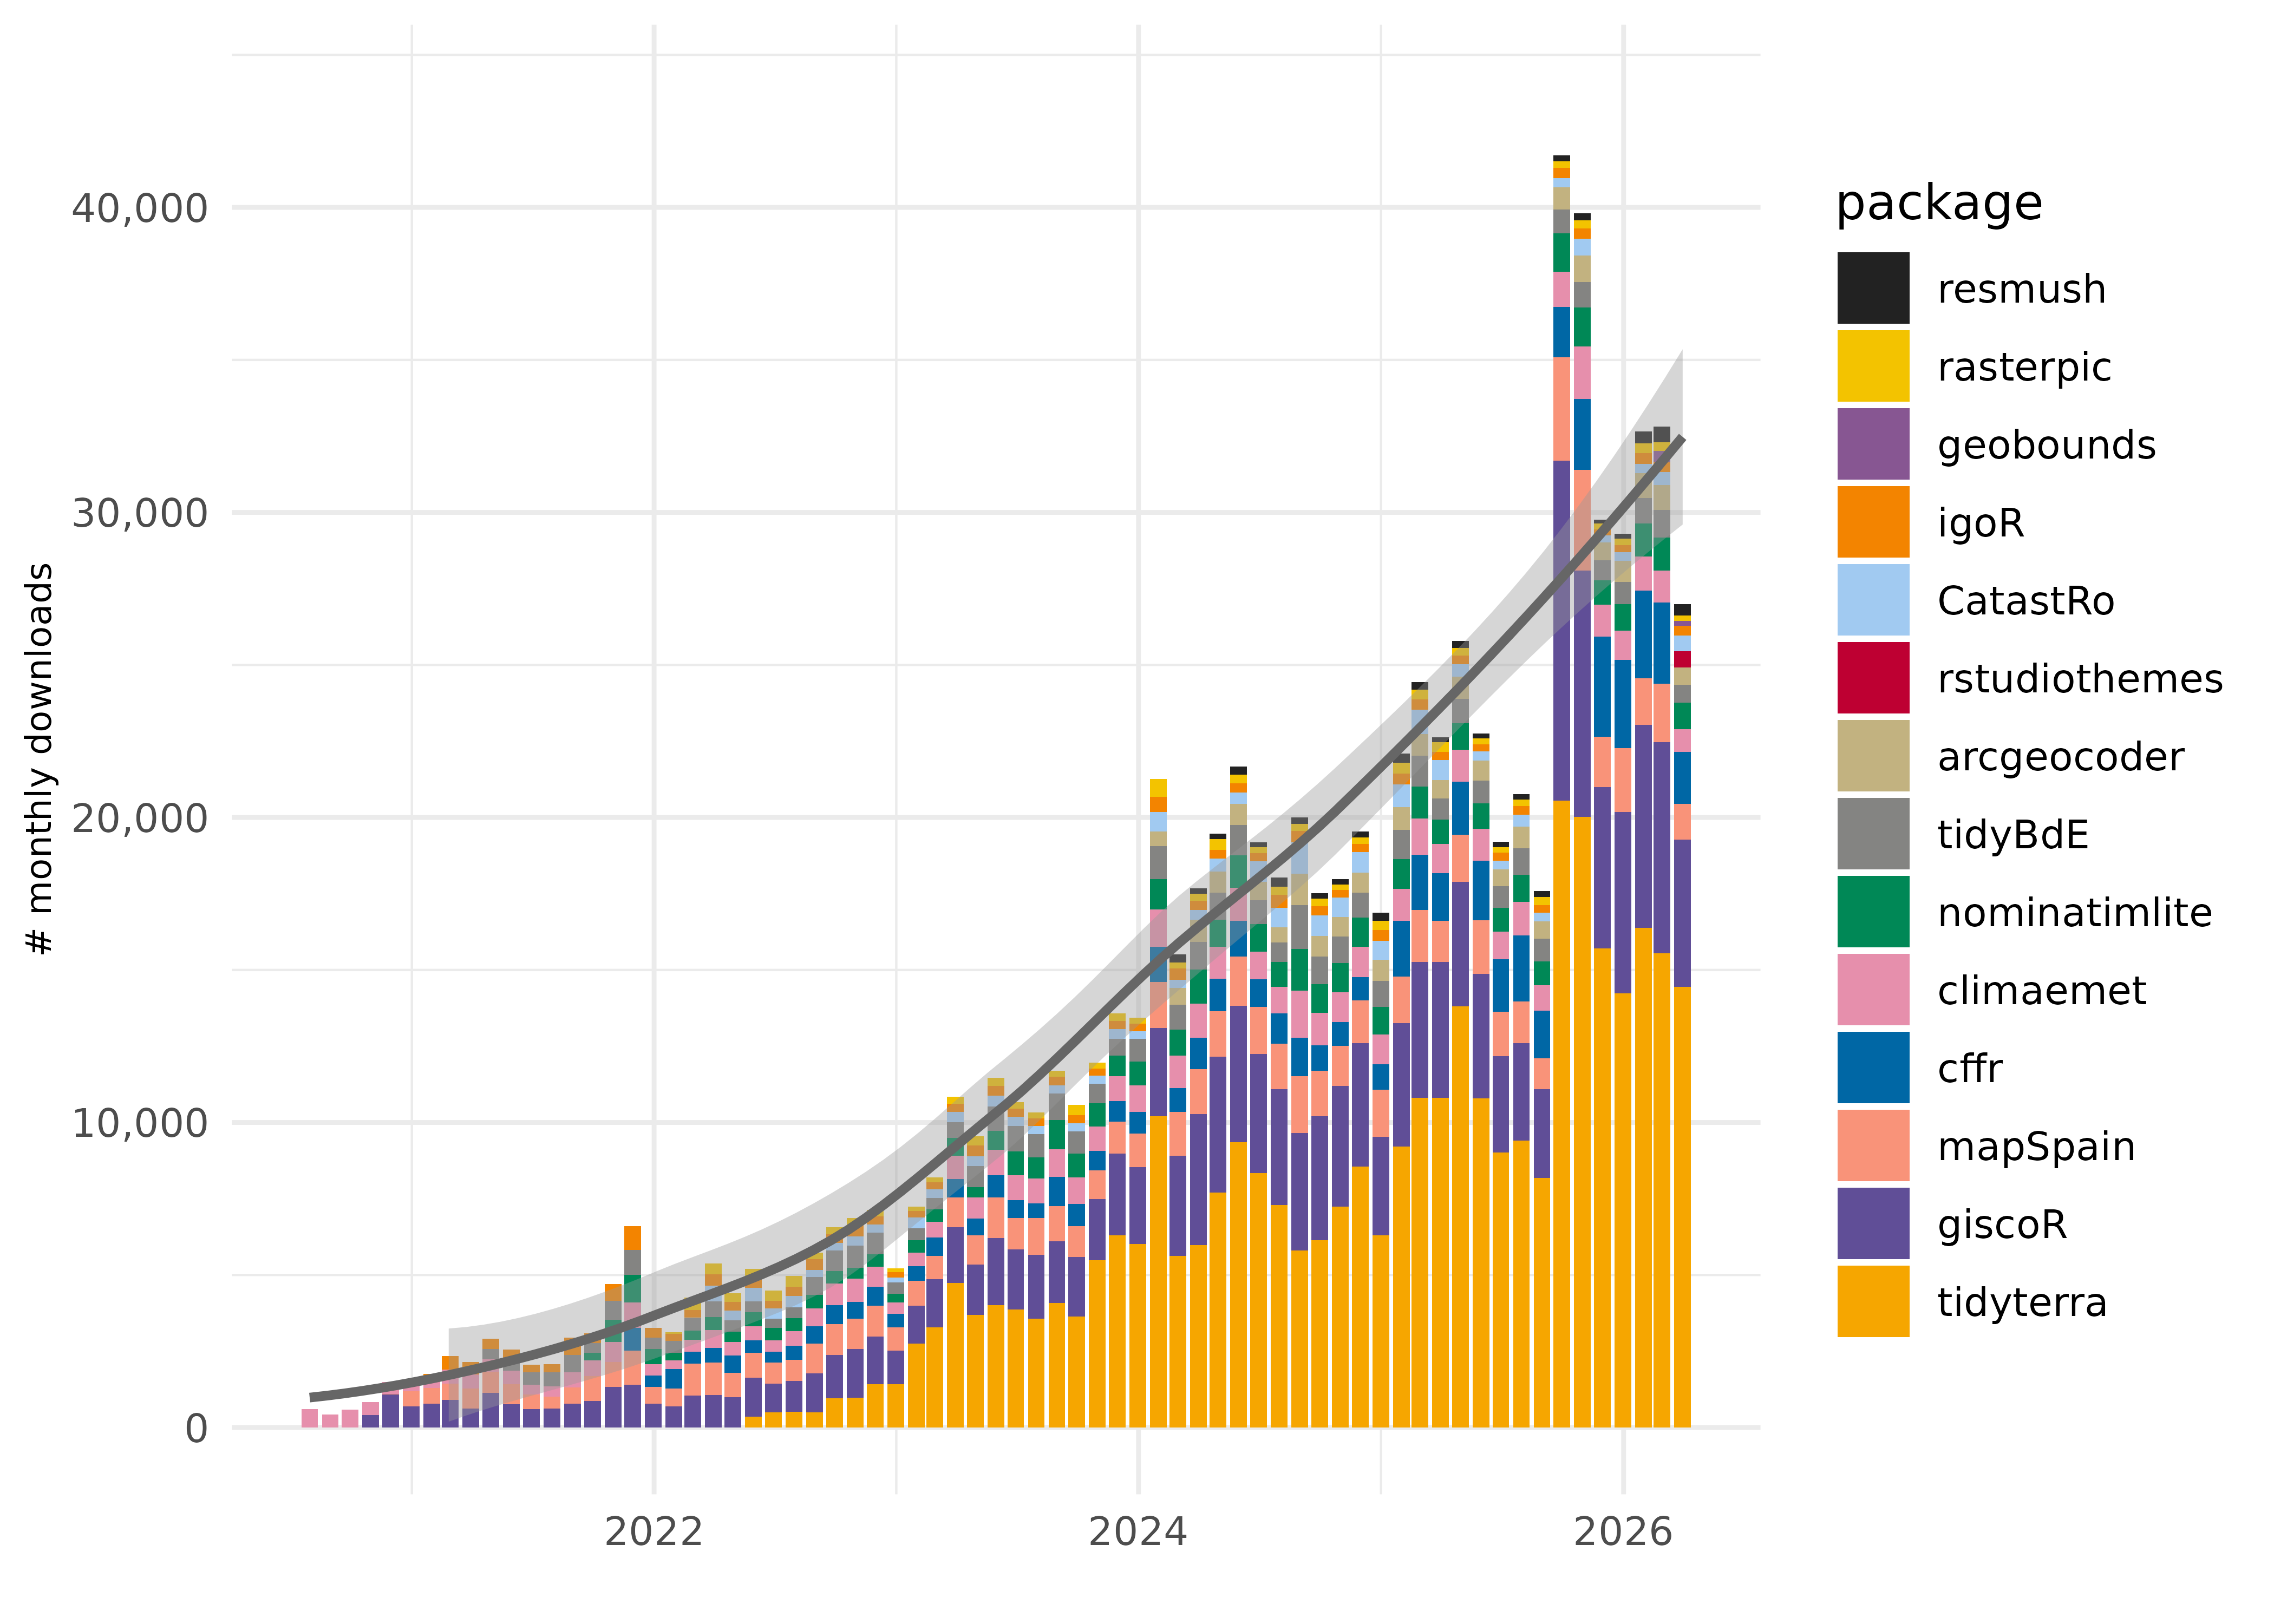
Stacked bar chart of monthly CRAN downloads over time, starting in 2016. The horizontal axis shows month and the vertical axis shows download count. Colored segments identify packages and each bar's total height gives their combined downloads. A gray smooth curve with a shaded uncertainty band summarizes the trend in total monthly downloads.

Weekly downloads

Faceted area chart of weekly CRAN downloads over the past year, with one panel per package arranged in three columns. The horizontal axis shows date and the vertical axis shows weekly download count. A dark smooth curve summarizes the trend in each panel. Vertical scales vary by package, so equal heights across panels can represent different download counts.

Download data

On Posit Package Manager

Download counts for my packages on Posit Package Manager.