On 27 Jan. 2022 my package rasterpic was accepted on CRAN (Hooray!!). This package allows to geotag images, using an spatial object (from sf or terra) as a geographic reference.
I tweeted about that, and it seems to have a good feedback from the #rspatial community:
#rspatial Do we need a package for using our own pictures as base maps? I don’t know, but anyway we have it! {rasterpic} 📦 is now on CRAN, and we can convert our pngs to spatial rasters like this https://t.co/fpoollARoN pic.twitter.com/l9o7rQwdgX
— dieghernan ن (@dhernangomez) January 27, 2022
I received also an interesting reply to this from Hefin Ioan Rhys @HRJ21:
Ooh I think a map with countries filled with their own flag would be poppin'.
— Hefin Ioan Rhys (@HRJ21) January 28, 2022
That remembers me to a previous post that I wrote when I added some new functions to the cartography package, now replaced by the mapsf package.
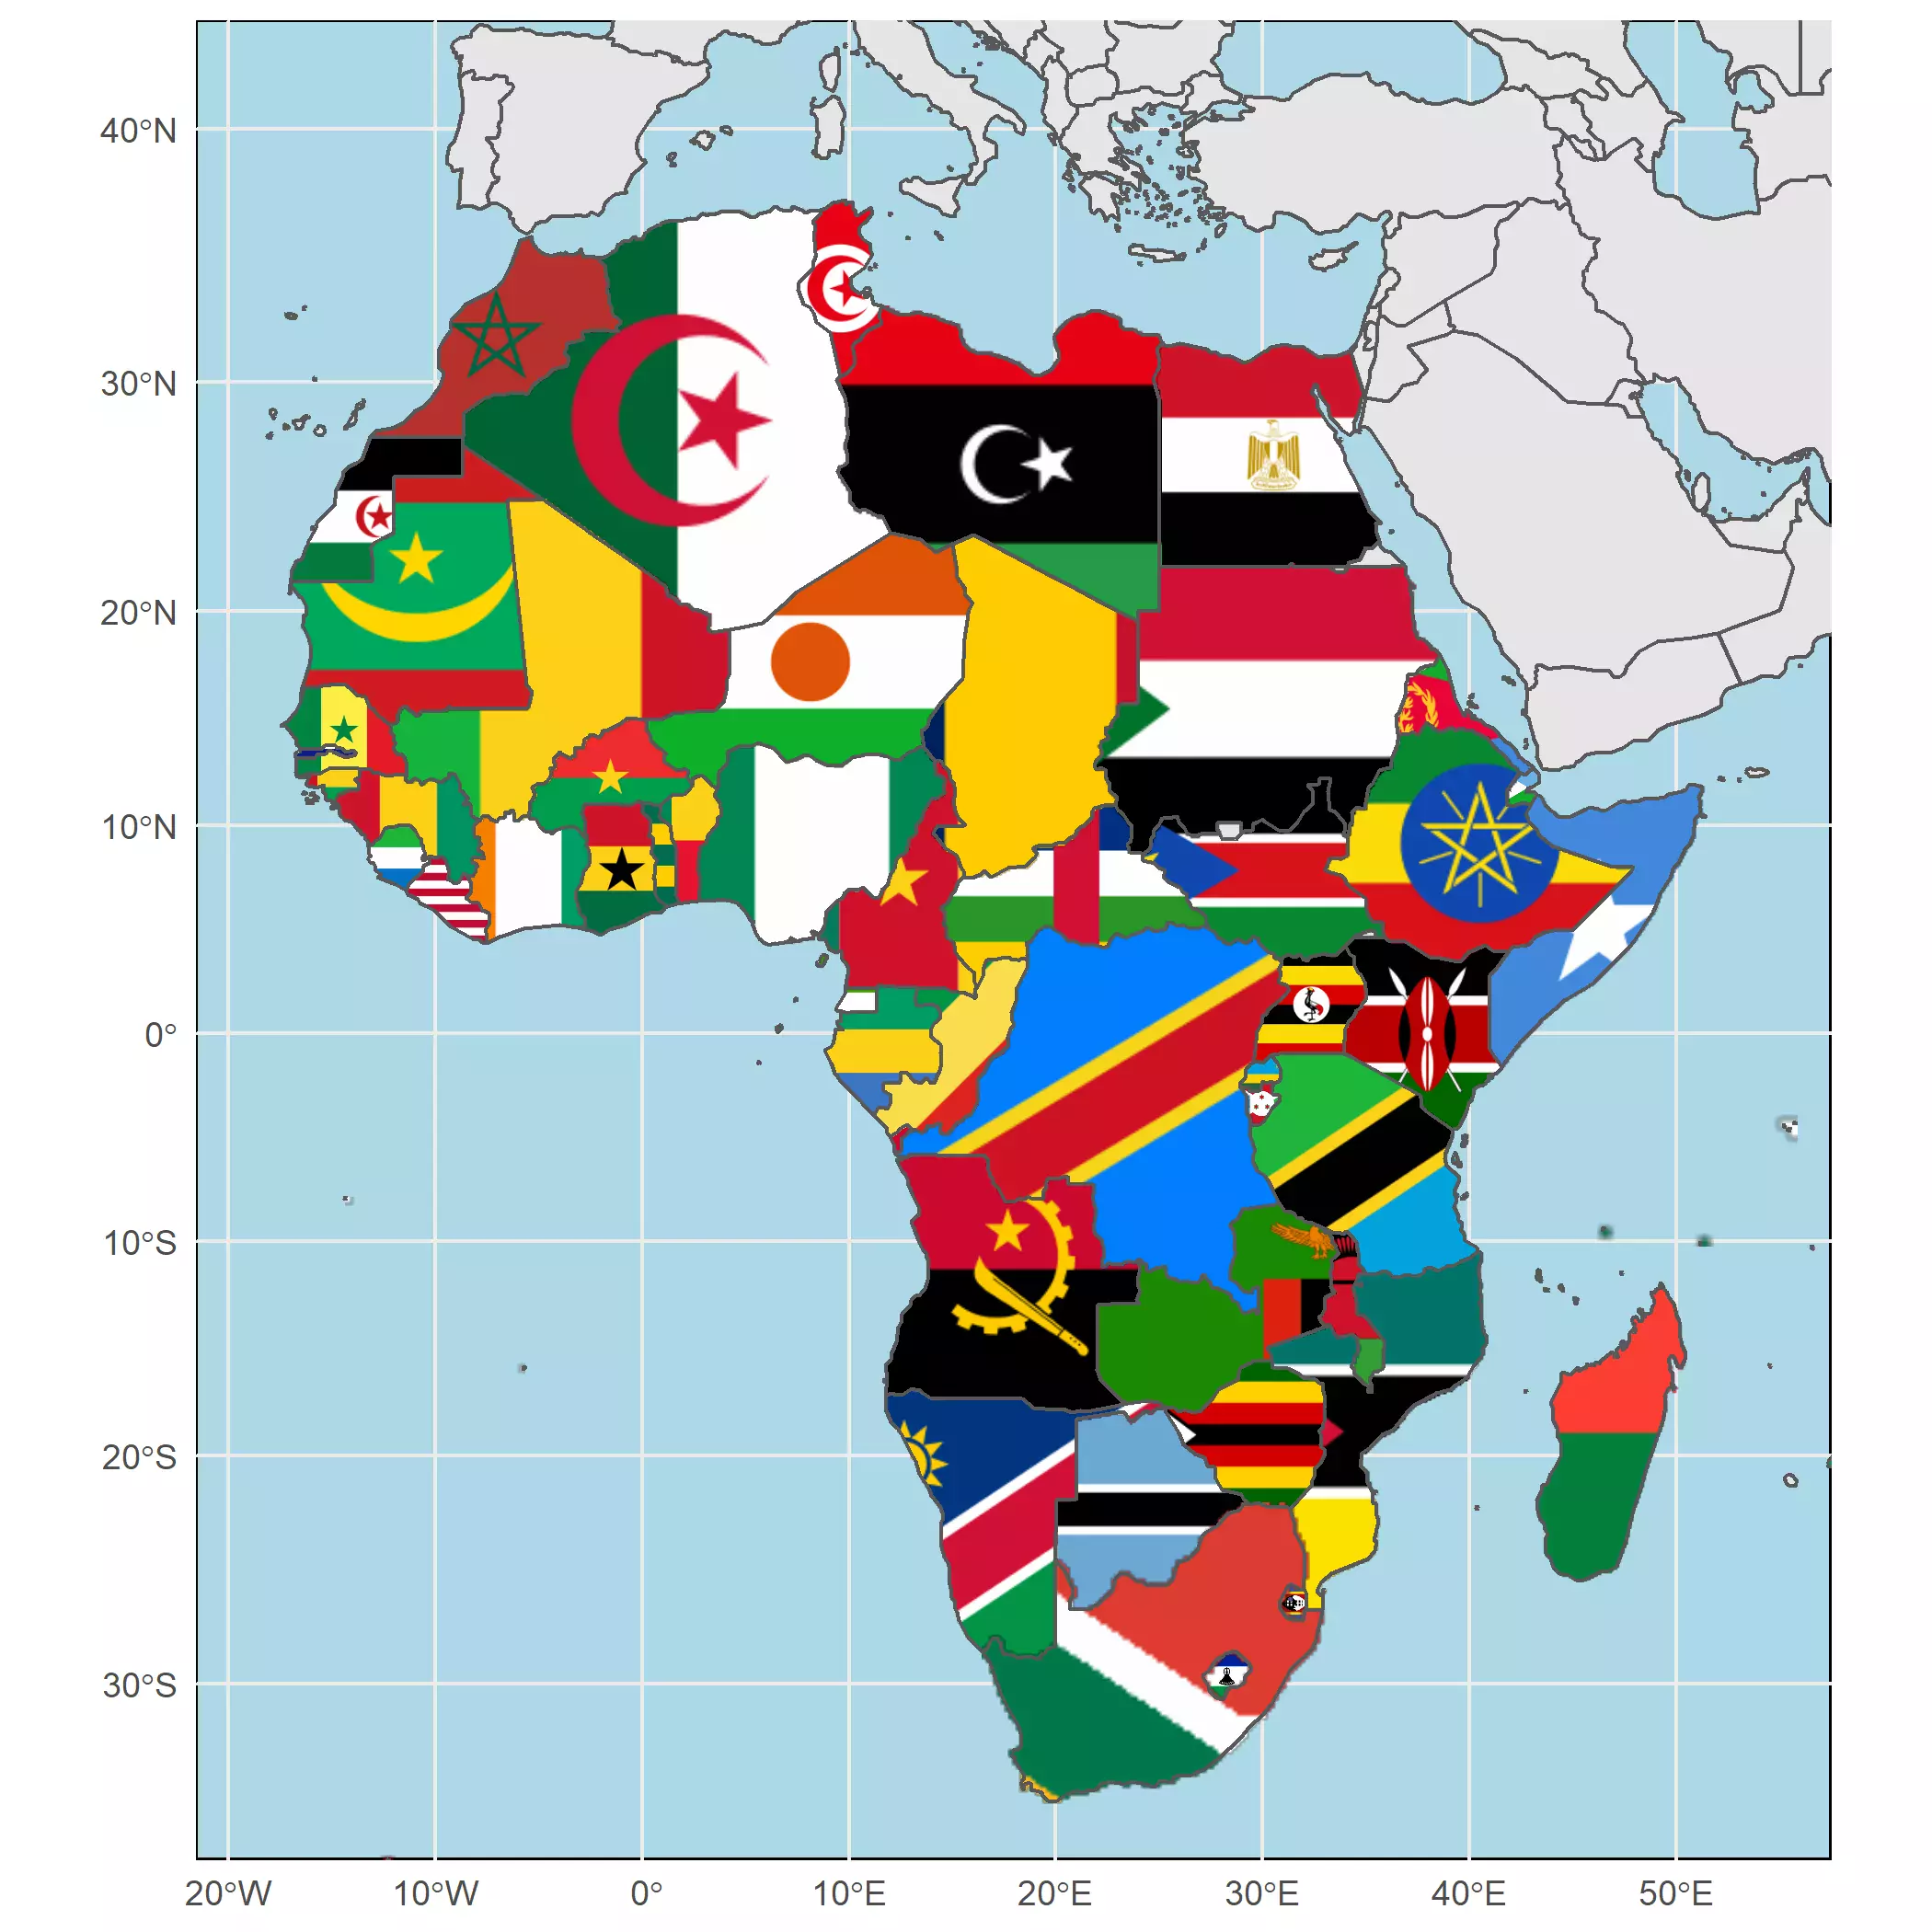
With rasterpic we have now an alternative tool for creating maps using images, and this quick post would show you how to do it.
I would replicate the Africa map presented on my previous plot, but this time I
would use newer packages, as
giscoR package, and the
development version of
ggspatial (not released
yet), that adds support to SpatRaster object on ggplot2. The flags would
be extracted from the GitHub repository
https://github.com/hampusborgos/country-flags.
# Development version of ggspatial
# devtools::install_github("paleolimbot/ggspatial")
library(ggspatial)
library(ggplot2)
library(giscoR)
library(dplyr)
library(rasterpic)

# For country names
library(countrycode)

world <- gisco_get_countries(epsg = 3857)
africa <- gisco_get_countries(region = "Africa", epsg = 3857)

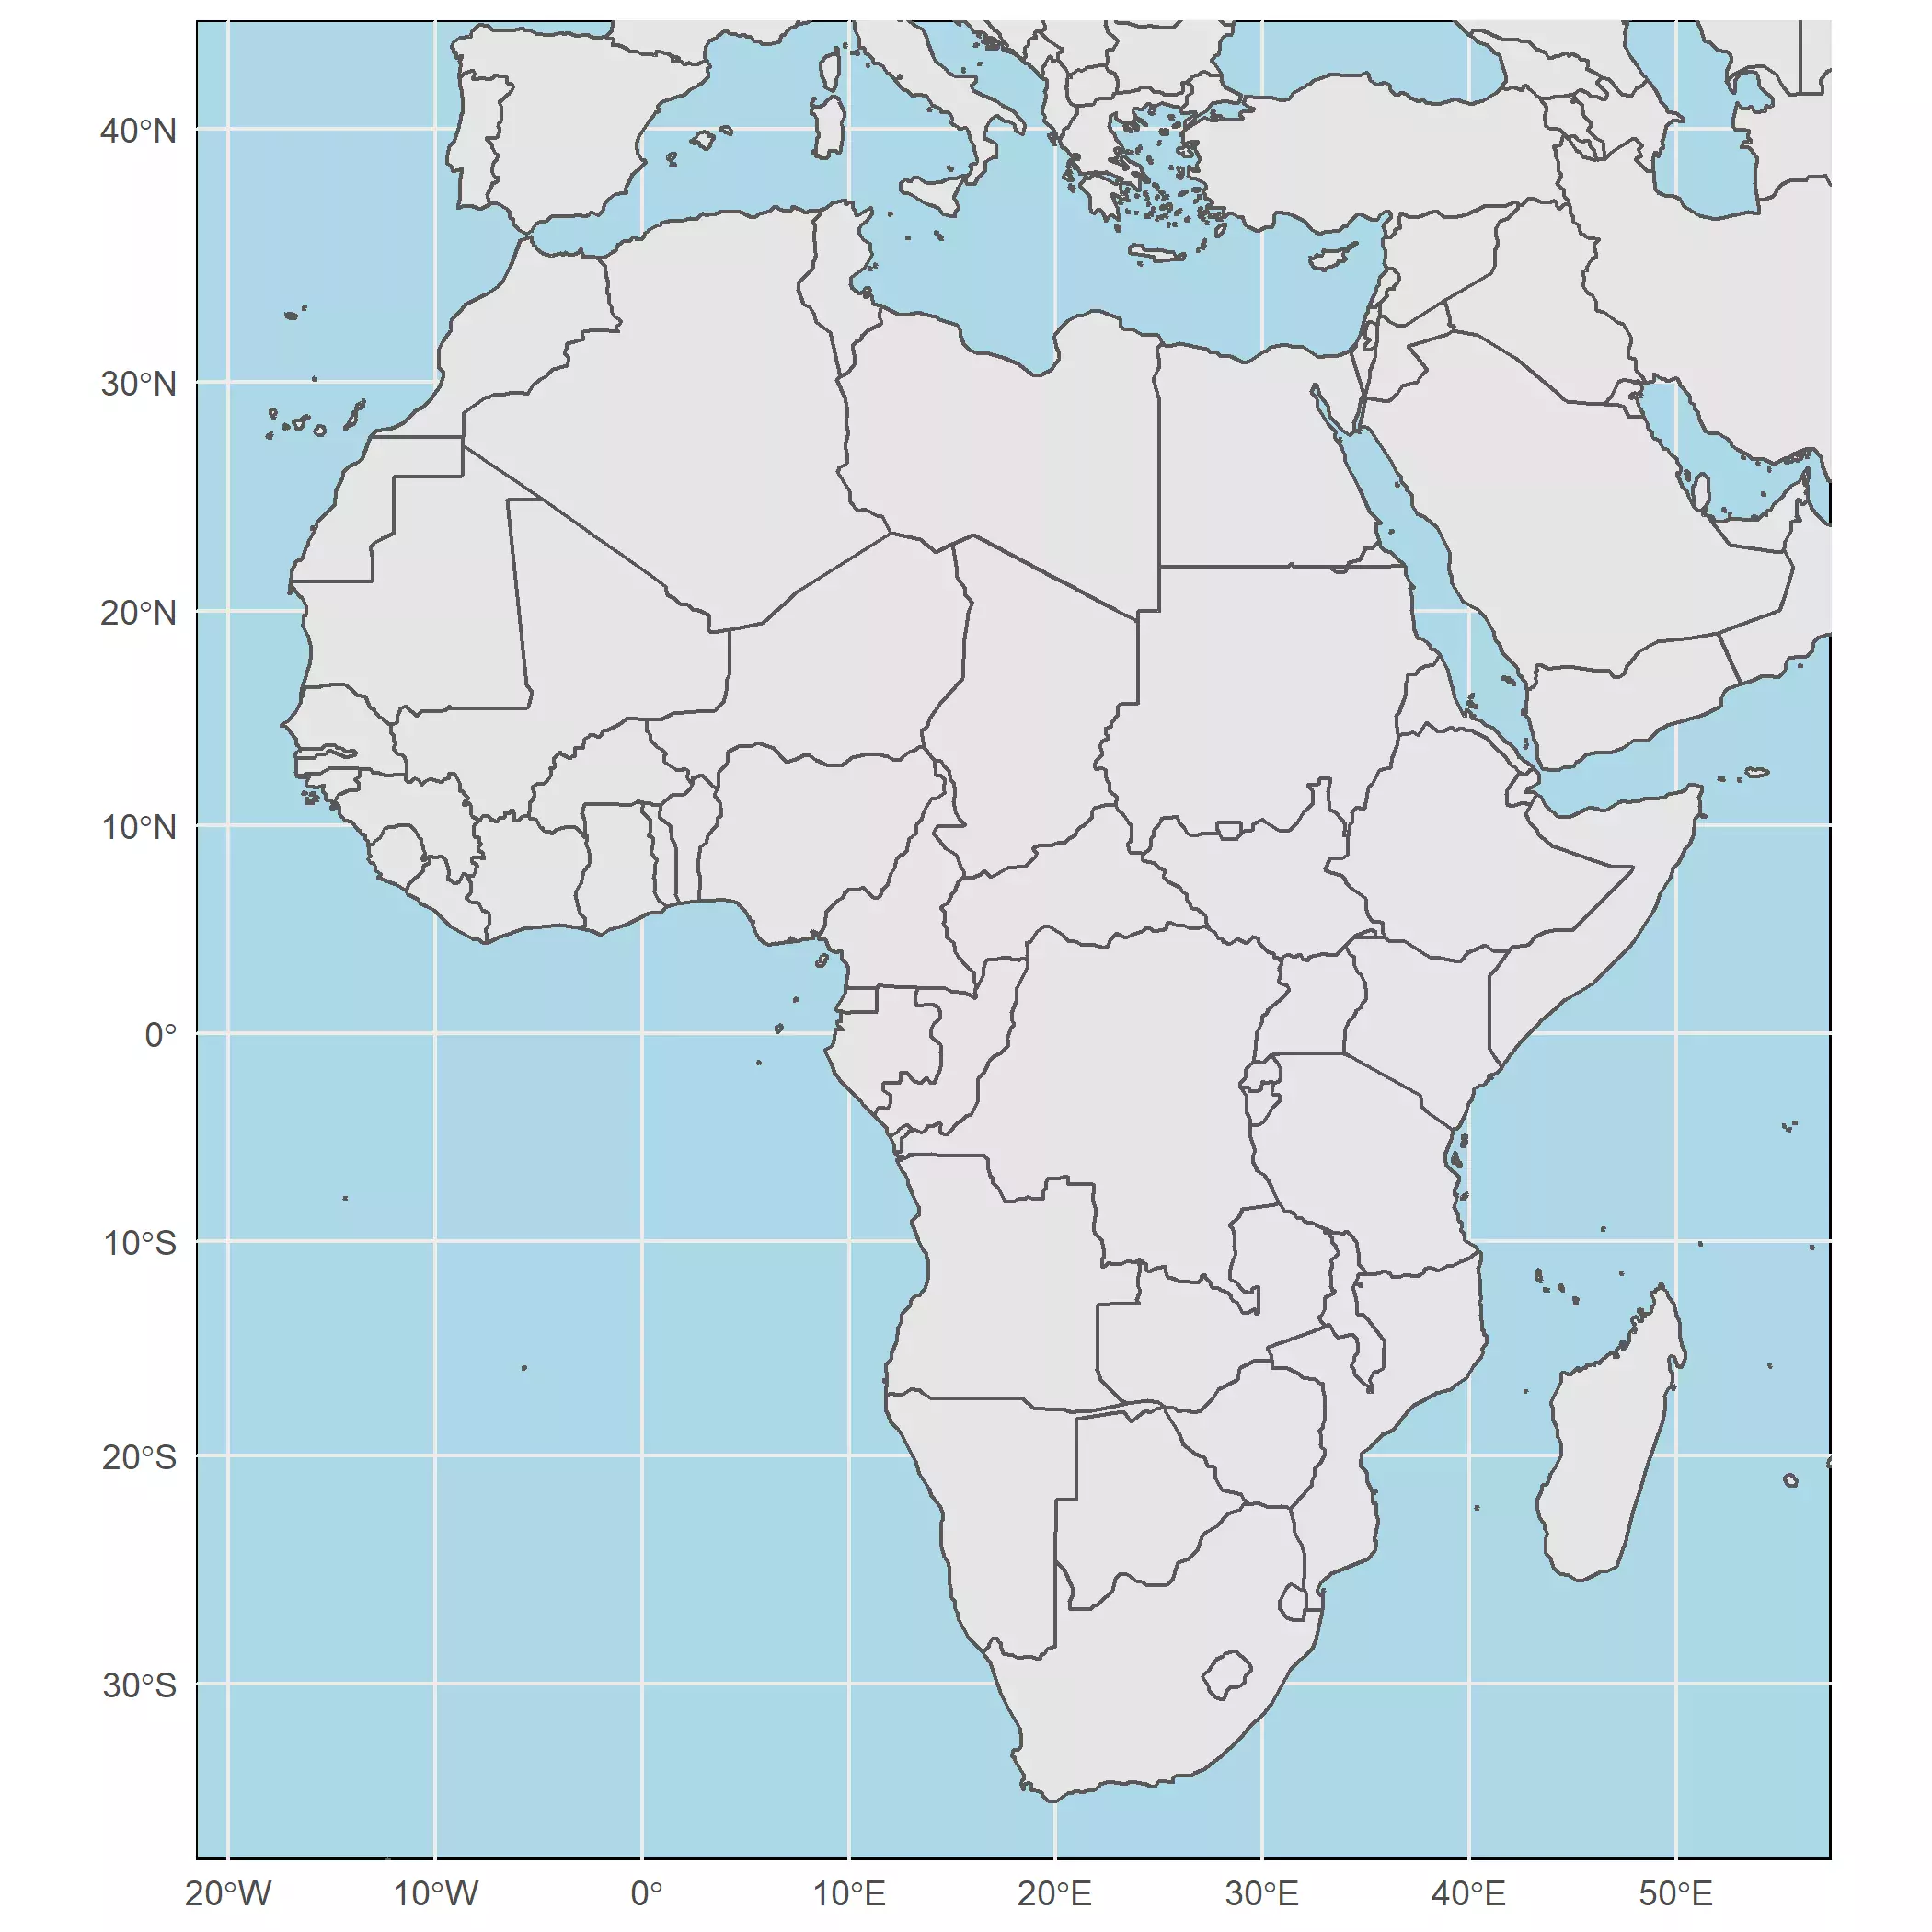
# Base map of Africa
plot <- ggplot(world) +
  geom_sf(fill = "grey90") +
  theme_minimal() +
  theme(panel.background = element_rect(fill = "lightblue"))

plot +
  # Zoom on Africa
  coord_sf(
    xlim = c(-2000000, 6000000),
    ylim = c(-4000000, 5000000)
  )

Now, let’s add the flags with a loop:
# We paste the ISO2 code to each african country
africa$iso2 <- countrycode(africa$ISO3_CODE, "iso3c", "iso2c")

# Get flags from repo - low quality to speed up the code
flagrepo <- "https://raw.githubusercontent.com/hjnilsson/country-flags/master/png250px/"

# Loop and add
for (iso in africa$iso2) {
  # Download pic and plot
  imgurl <- paste0(flagrepo, tolower(iso), ".png")
  tmpfile <- tempfile(fileext = ".png")
  download.file(imgurl, tmpfile, quiet = TRUE, mode = "wb")

  # Raster
  x <- africa %>% filter(iso2 == iso)
  x_rast <- rasterpic_img(x, tmpfile, crop = TRUE, mask = TRUE)
  plot <- plot + layer_spatial(x_rast)
}

plot +
  geom_sf(data = africa, fill = NA) +
  # Zoom on Africa
  coord_sf(
    xlim = c(-2000000, 6000000),
    ylim = c(-4000000, 5000000)
  )
