Issue 3 of 3
Issues: Map projections with R
Creating maps with R is usually straightforward, but representations that cross the International Date Line or that use polar projections can be tricky.
Different spatial-data providers use different conventions: some break geometries at certain longitudes (for example, cutting the Chukchi Peninsula), while others omit portions of the data. These inconsistencies can produce awkward artifacts near the poles.
In this post, I fix the GISCO (European Commission) shapefile for Antarctica and produce clean orthographic maps.
# Libraries
library(tidyverse)
library(sf)
library(giscoR)
library(ggrepel)
library(rmapshaper)

# Define a common theme for the maps.
background <- "#E2ECF2"

map_family <- "inter-tight"
sysfonts::font_add_google("Inter Tight", family = map_family)
showtext::showtext_opts(dpi = knitr::opts_chunk$get("dpi"))
showtext::showtext_auto()

theme_set(
  theme_grey(paper = background) +
    theme(
      text = element_text(family = map_family),
      plot.title = element_text(face = "bold"),
      plot.margin = margin(10, 10, 10, 10)
    )
)
Fixing the geometry
First, we retrieve the Antarctic geometry from GISCO and transform it to an orthographic projection centered on the South Pole.
antarct <- gisco_get_countries(year = 2024, resolution = 1, country = "ATA") %>%
  select(NAME = NAME_ENGL) |>
  # Orthographic projection centered on the South Pole
  st_transform(crs = "+proj=ortho +lat_0=-90 +lon_0=0")

ggplot(antarct) +
  geom_sf(fill = "lightblue")

Updated November 14, 2026. The original post showed how to repair the geometry by editing vertices manually. This version uses a buffer.
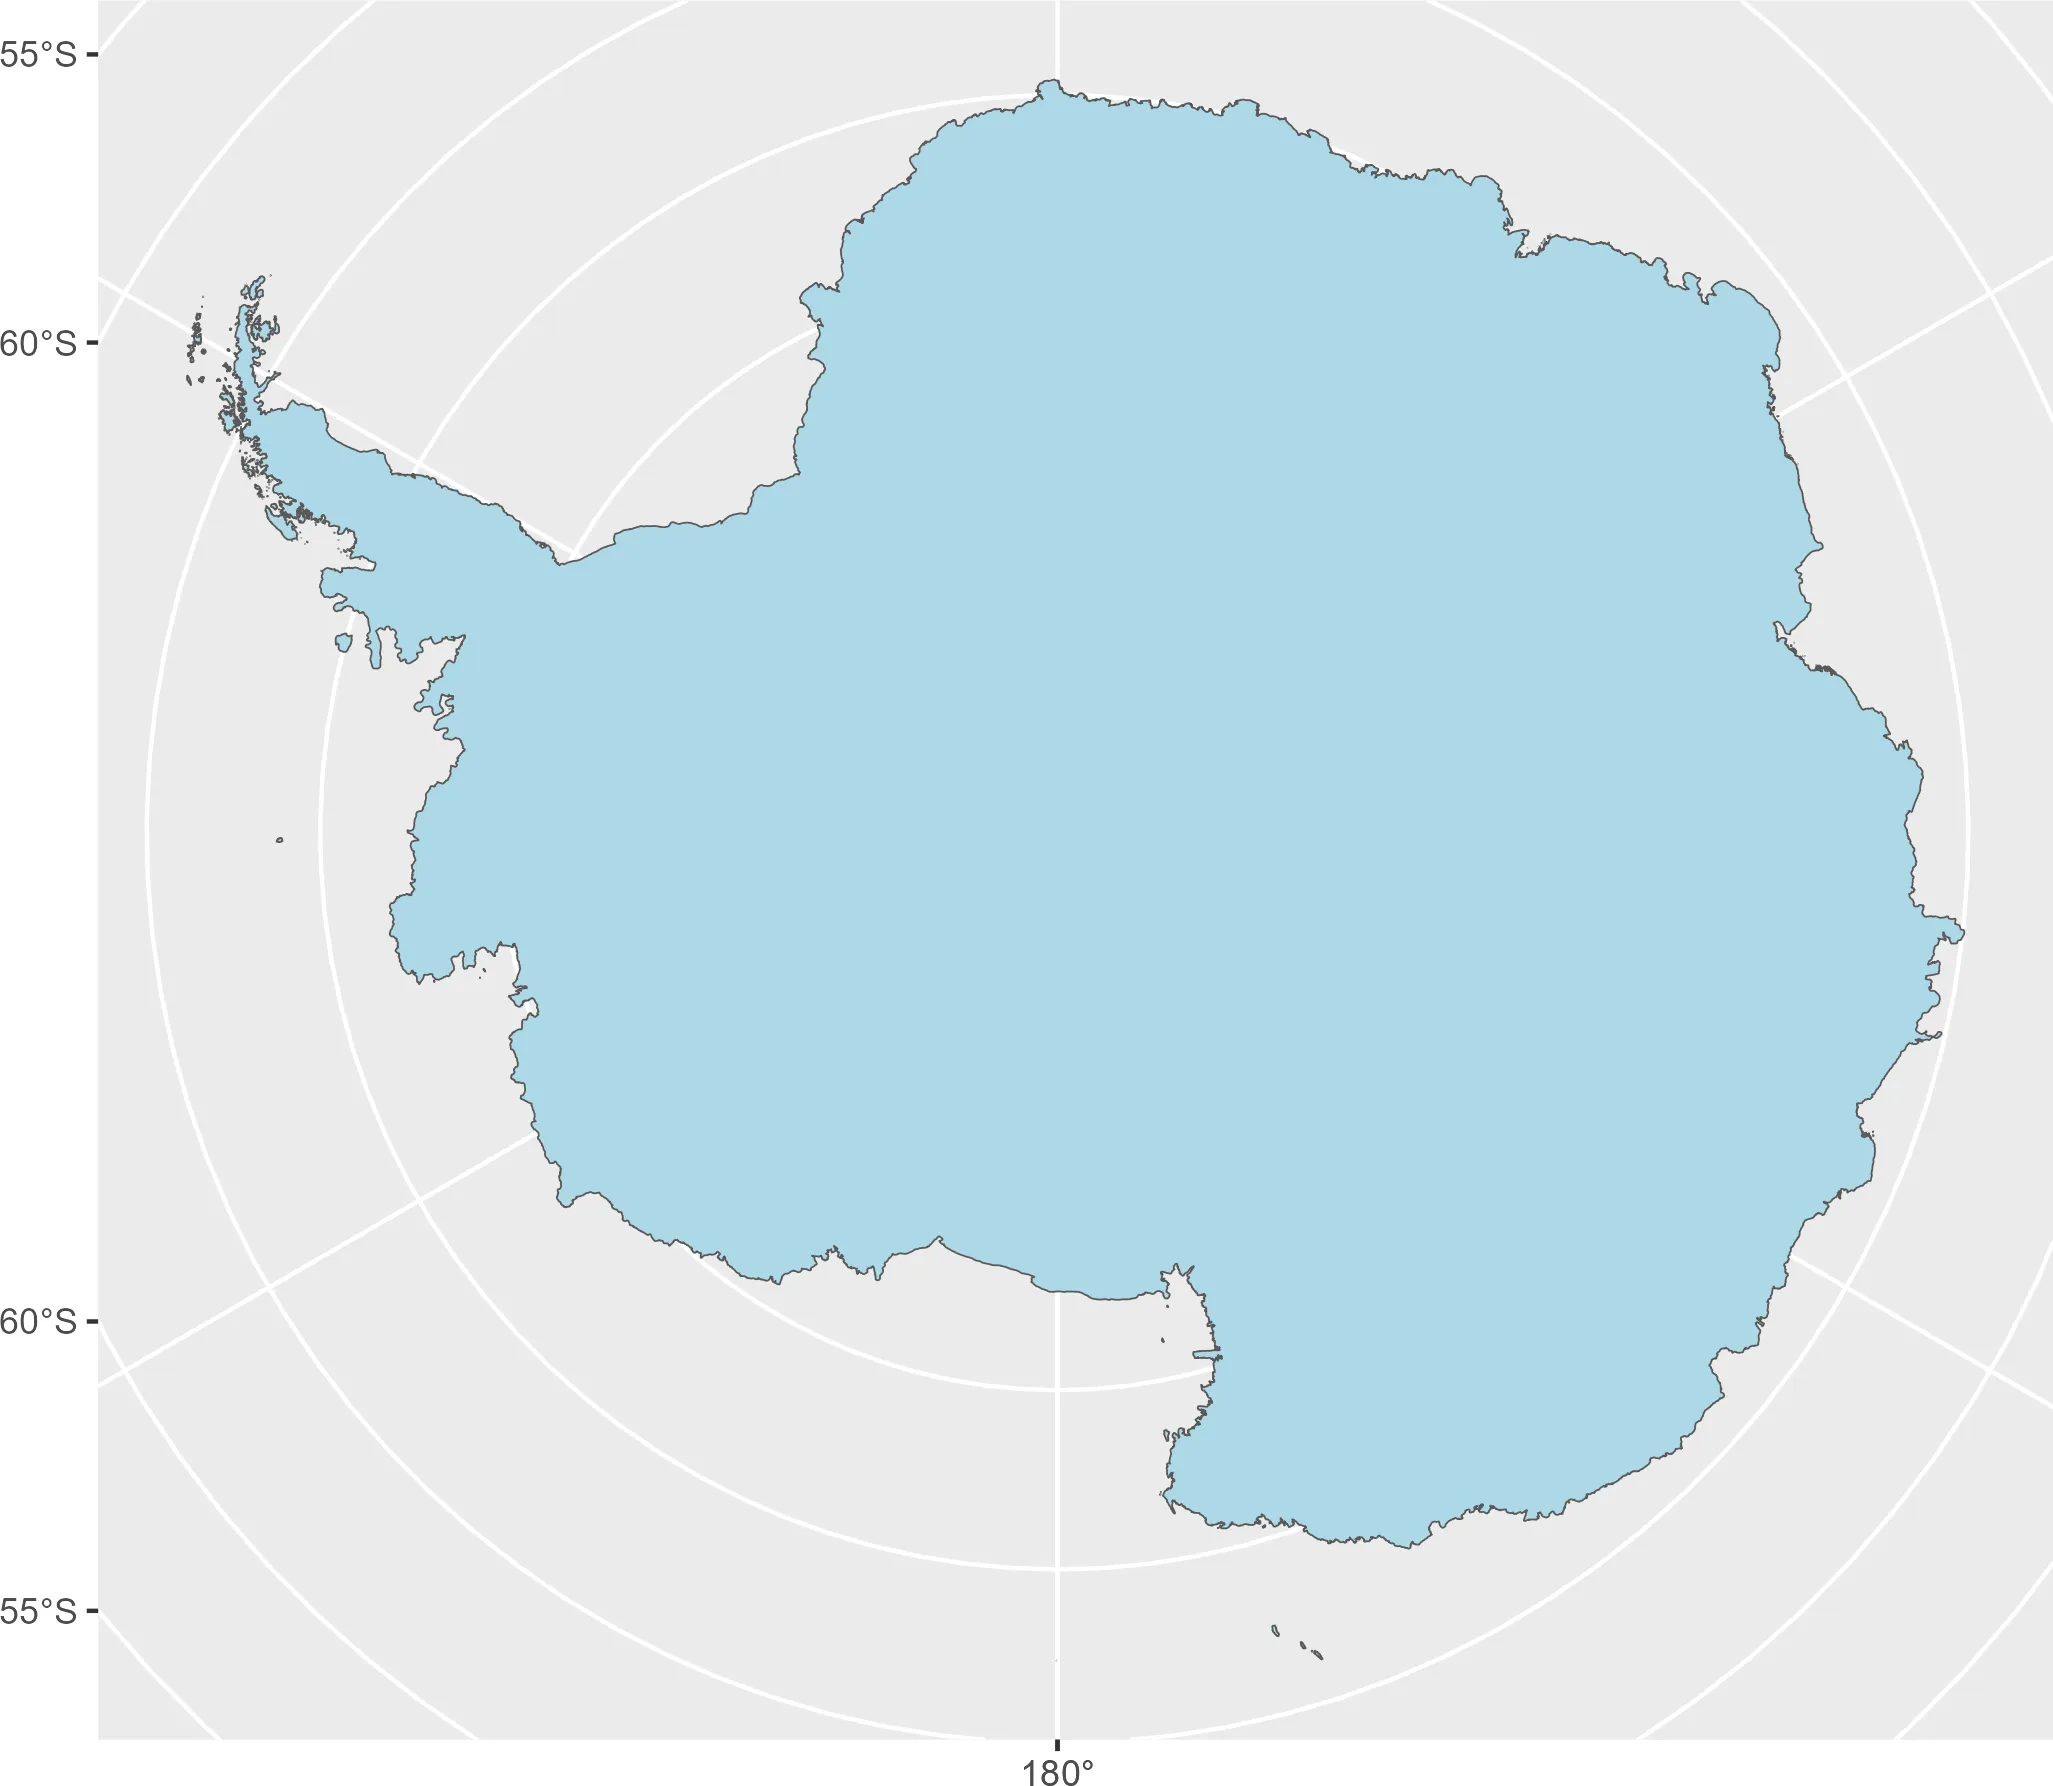
In the orthographic projection, a narrow gap runs inland from the coast. I close it by applying a 2-meter buffer:
# Regenerate initial shape
antarctica_fixed <- st_buffer(antarct, 2)

ggplot(antarctica_fixed) +
  geom_sf(fill = "lightblue")
Plotting examples
With the corrected geometry, we can draw the maps. Below are a few examples based on proposed Antarctic flag designs.
Graham Bartram’s proposal (1996)
A simple rendition of Bartram’s original concept:
bbox <- st_bbox(antarctica_fixed) # For limits on the panel

antarctica_fixed |>
  ggplot() +
  geom_sf(fill = "white", color = NA) +
  theme(
    panel.background = element_rect(fill = "#009fdc"),
    panel.grid = element_blank(),
    axis.text = element_blank(),
    axis.ticks = element_blank()
  ) +
  labs(title = "Graham Bartram's proposal") +
  coord_sf(
    xlim = c(bbox[c(1, 3)]) * 1.8,
    ylim = c(bbox[c(2, 4)]) * 1.4
  )

Emblem of the Antarctic Treaty
This example uses graticules to create a concentric “bullseye” pattern around Antarctica. Generating such graticules and merging meridians requires a few extra steps to avoid small gaps near the pole.
# Need graticules
grats <- giscoR::gisco_get_countries() |>
  st_transform(st_crs(antarctica_fixed)) |>
  # Specify the cuts of the graticules
  st_graticule(
    lat = c(-80, -70, -60),
    lon = seq(-180, 180, 30),
    ndiscr = 10000,
    margin = 0.000001
  )


ggplot(grats) +
  geom_sf(color = "darkblue")

We merge meridians so the area around the South Pole is filled. st_graticule()
can leave a tiny hole at the pole, and we fix this by joining complementary
meridians.
# Merge meridians
merid <- lapply(seq(-180, 0, 30), function(x) {
  df <- grats |>
    filter(type == "E") |>
    filter(degree %in% c(x, x + 180))

  df2 <- df |>
    st_geometry() |>
    st_cast("MULTIPOINT") |>
    st_union() |>
    st_cast("LINESTRING")

  sf_x <- st_sf(
    degree = x,
    type = "E",
    geometry = df2
  )
}) |> bind_rows()


grats_end <- merid |>
  bind_rows(grats |>
    filter(type != "E"))
We then cut and color the resulting graticules so they form the emblem-like pattern.
# Cut since some grats should be colored differently

antarctica_simp <- rmapshaper::ms_simplify(antarctica_fixed, keep = 0.005)
grats_yes <- st_intersection(grats_end, antarctica_simp)
grats_no <- st_difference(grats_end, antarctica_simp)

antarctica_simp |>
  ggplot() +
  geom_sf(fill = "white", color = NA) +
  theme(
    panel.background = element_rect(fill = "#072b5f"),
    panel.grid = element_blank(),
    axis.text = element_blank(),
    axis.ticks = element_blank()
  ) +
  geom_sf(data = grats_yes, color = "#072b5f", linewidth = 1) +
  geom_sf(data = grats_no, color = "white", linewidth = 1) +
  coord_sf(
    xlim = c(bbox[c(1, 3)]) * 1.8,
    ylim = c(bbox[c(2, 4)]) * 1.4
  ) +
  labs(title = "Emblem of the Antarctic Treaty")

Bartram’s redesigned Antarctic flag
In 2024, Graham Bartram revealed a new version of his original flag as part of a global campaign to raise awareness about the growing problem of microplastic pollution. The new design keeps the familiar white outline of Antarctica but swaps the plain blue background for one filled with countless tiny, colorful dots. These dots represent the microscopic bits of plastic that have been discovered even in the planet’s most untouched places, including the Antarctic ice and its surrounding oceans.

Because the design relies on randomness, we approximate it using the following procedure:
- Sample random points across the Antarctic polygon.
- Build Voronoi polygons from those points, then apply a small negative buffer to create gaps.
- Randomly sample the resulting polygons to increase visual noise.
- Color polygons so larger areas remain white while smaller polygons use shades of pink and magenta.
# Use the repaired Antarctic geometry

set.seed(2024)
# Sample, Voronoi and negative buffer
plastics <- st_sample(antarctica_fixed, 3000) |>
  st_union() |>
  st_voronoi(envelope = st_geometry(antarctica_fixed)) |>
  st_collection_extract() |>
  st_buffer(dist = -10000)


# Keep only those properly included in the outline

toinc <- st_contains_properly(antarctica_fixed, plastics, sparse = FALSE) |>
  as.vector()

# Select random chunks
plastic_end <- plastics[toinc, ] |>
  st_as_sf() |>
  slice_sample(prop = 0.75)

ggplot(plastic_end) +
  geom_sf(fill = "darkblue")

# Random coloring

plastic_end$area <- st_area(plastic_end) |> as.double()

plastic_end$fill <- sample(c("#ff00ec", "#9e00ec"), nrow(plastic_end), replace = TRUE)
plastic_end$fill <- ifelse(plastic_end$area > quantile(plastic_end$area, probs = 0.4),
  "white",
  plastic_end$fill
)

bbox2 <- st_bbox(plastic_end)
ggplot() +
  geom_sf(data = plastic_end, aes(fill = fill), color = NA, linewidth = 0) +
  scale_fill_identity() +
  theme(
    panel.background = element_rect(fill = "#009fdc"),
    panel.grid = element_blank(),
    axis.text = element_blank(),
    axis.ticks = element_blank()
  ) +
  labs(title = "New redesign") +
  coord_sf(
    xlim = c(bbox2[c(1, 3)] * 1.8),
    ylim = c(bbox2[c(2, 4)]) * 1.4
  )

How to cite this post
For attribution, please cite this work as:
Hernangómez, D. (2025, October 25). Mapping Antarctica. One World. https://dieghernan.github.io/202510_mapping-antarctica/
BibTeX
@misc{post20251025-mapping-antarctica,
  author = {Hernangómez, Diego},
  title = {Mapping Antarctica},
  year = {2025},
  month = oct,
  howpublished = {One World},
  url = {https://dieghernan.github.io/202510_mapping-antarctica/},
}