Example 1: Map sf objects
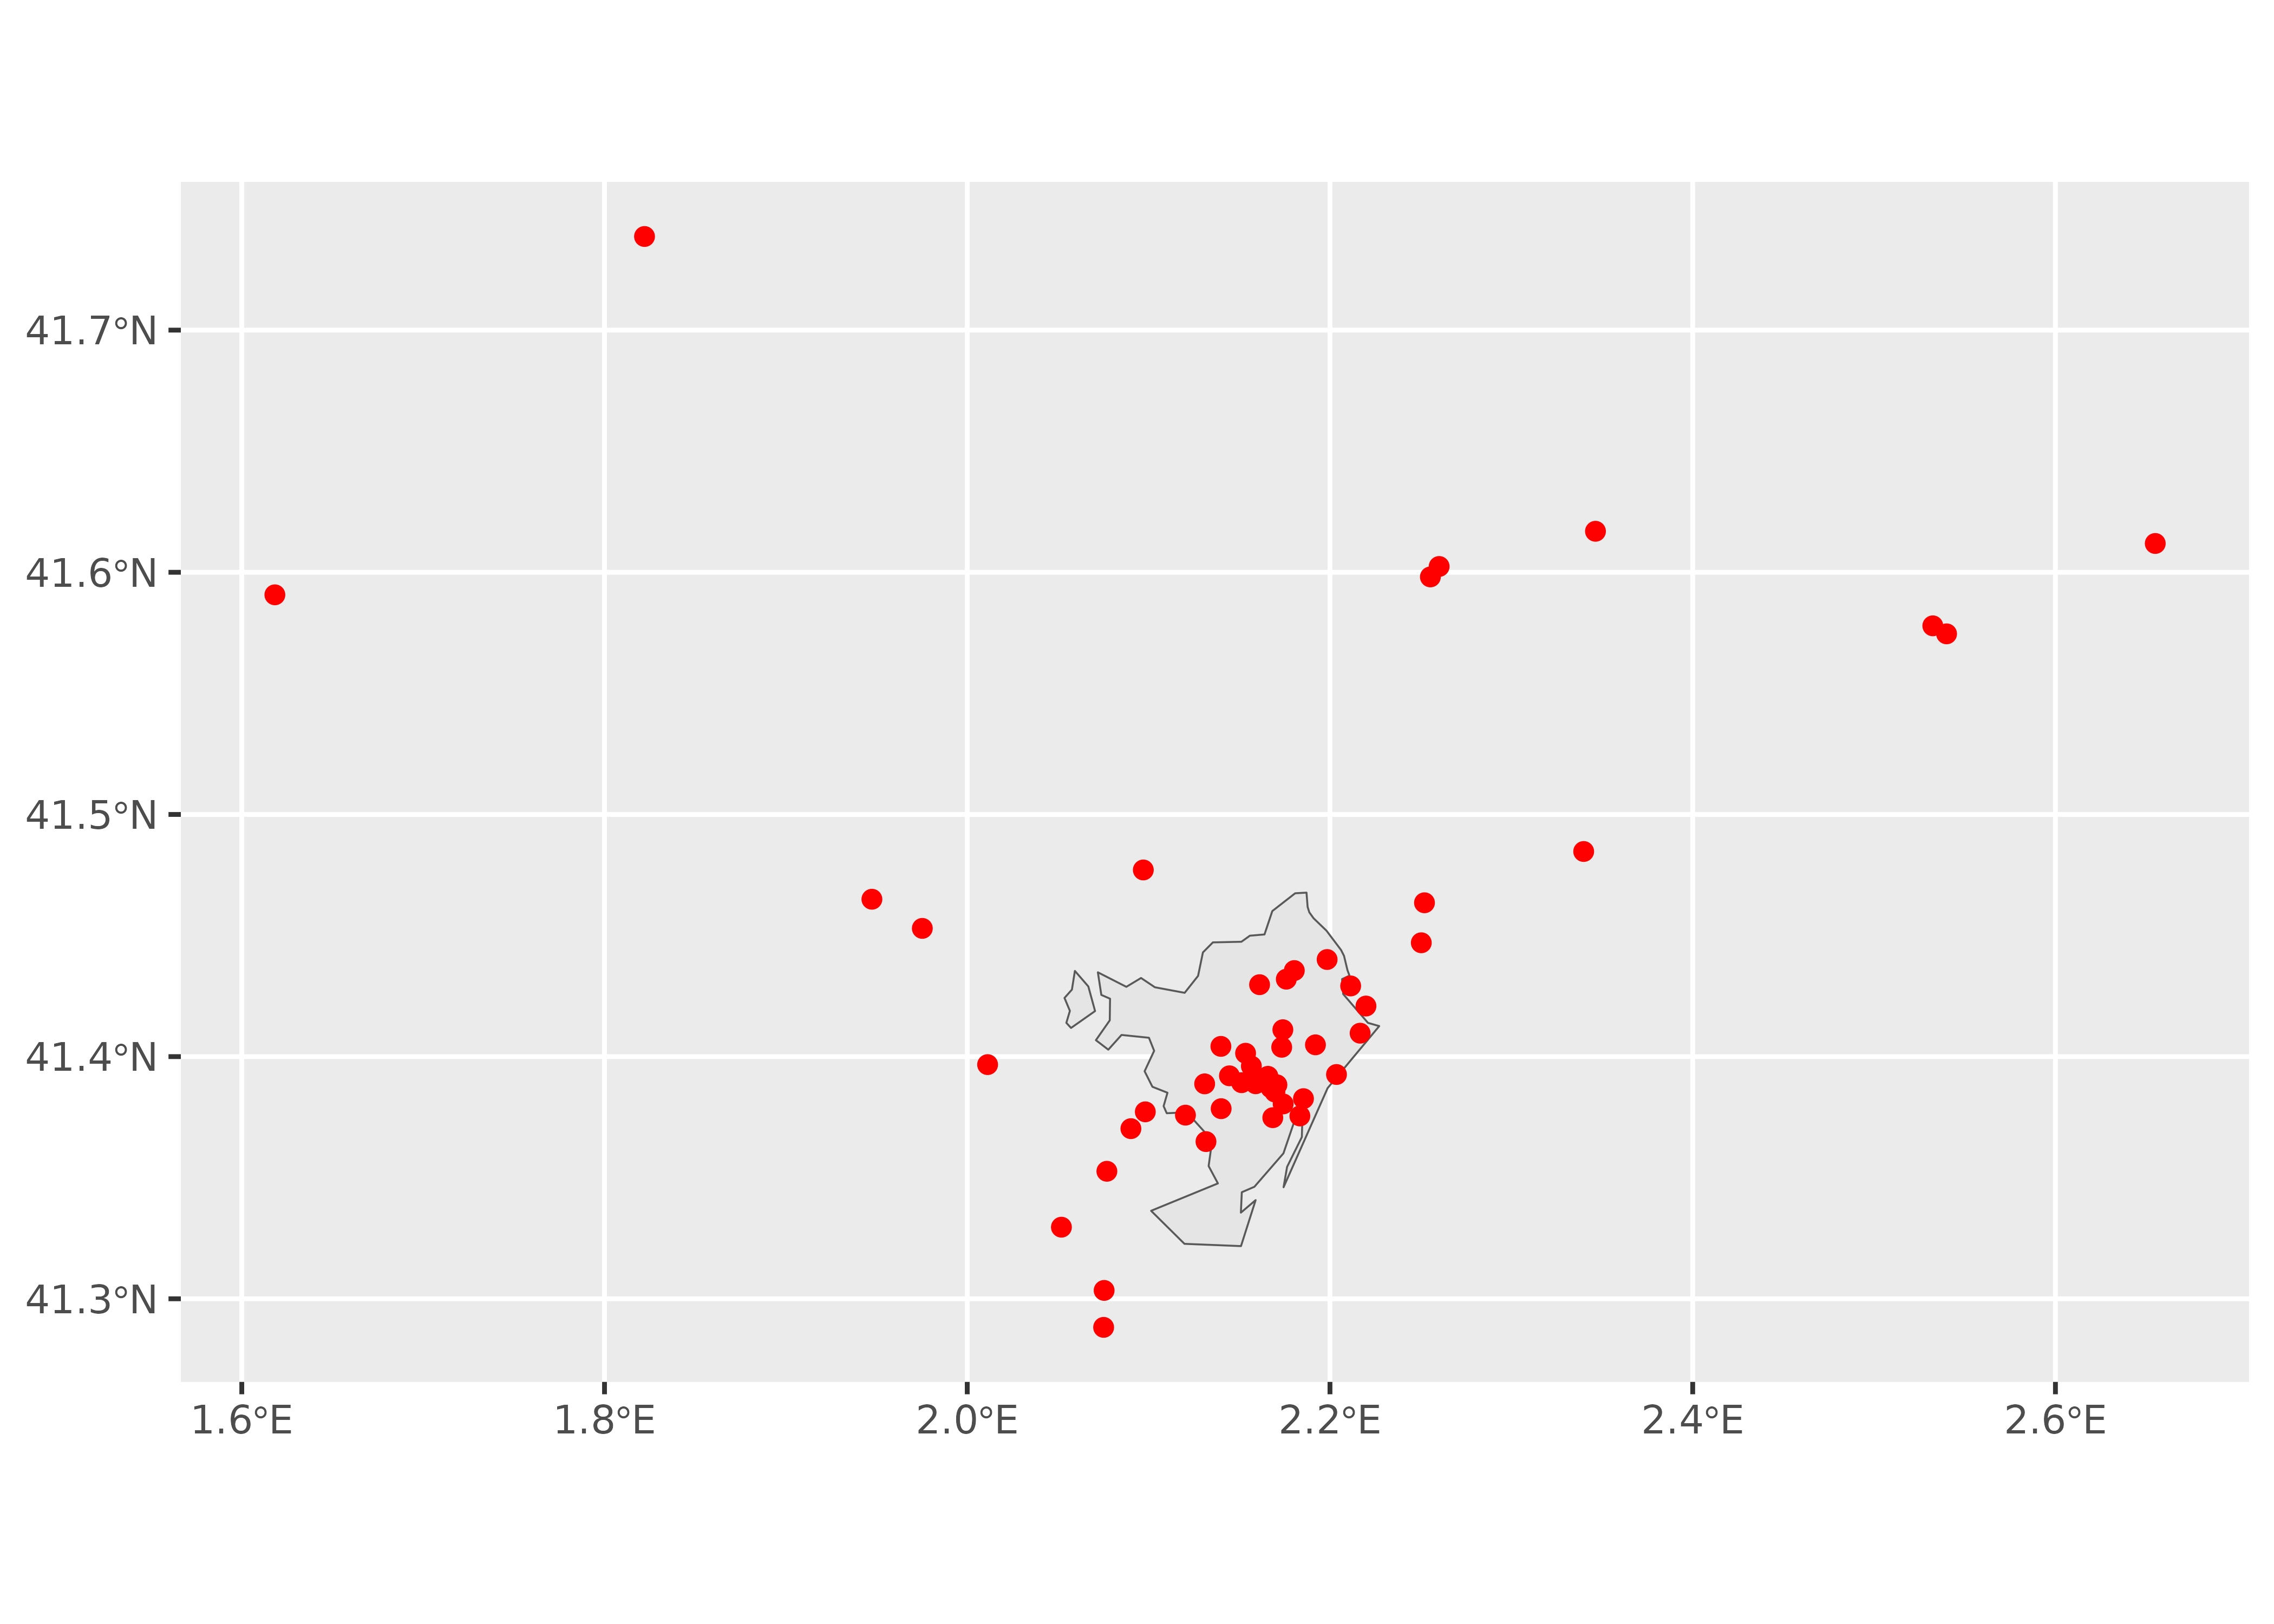
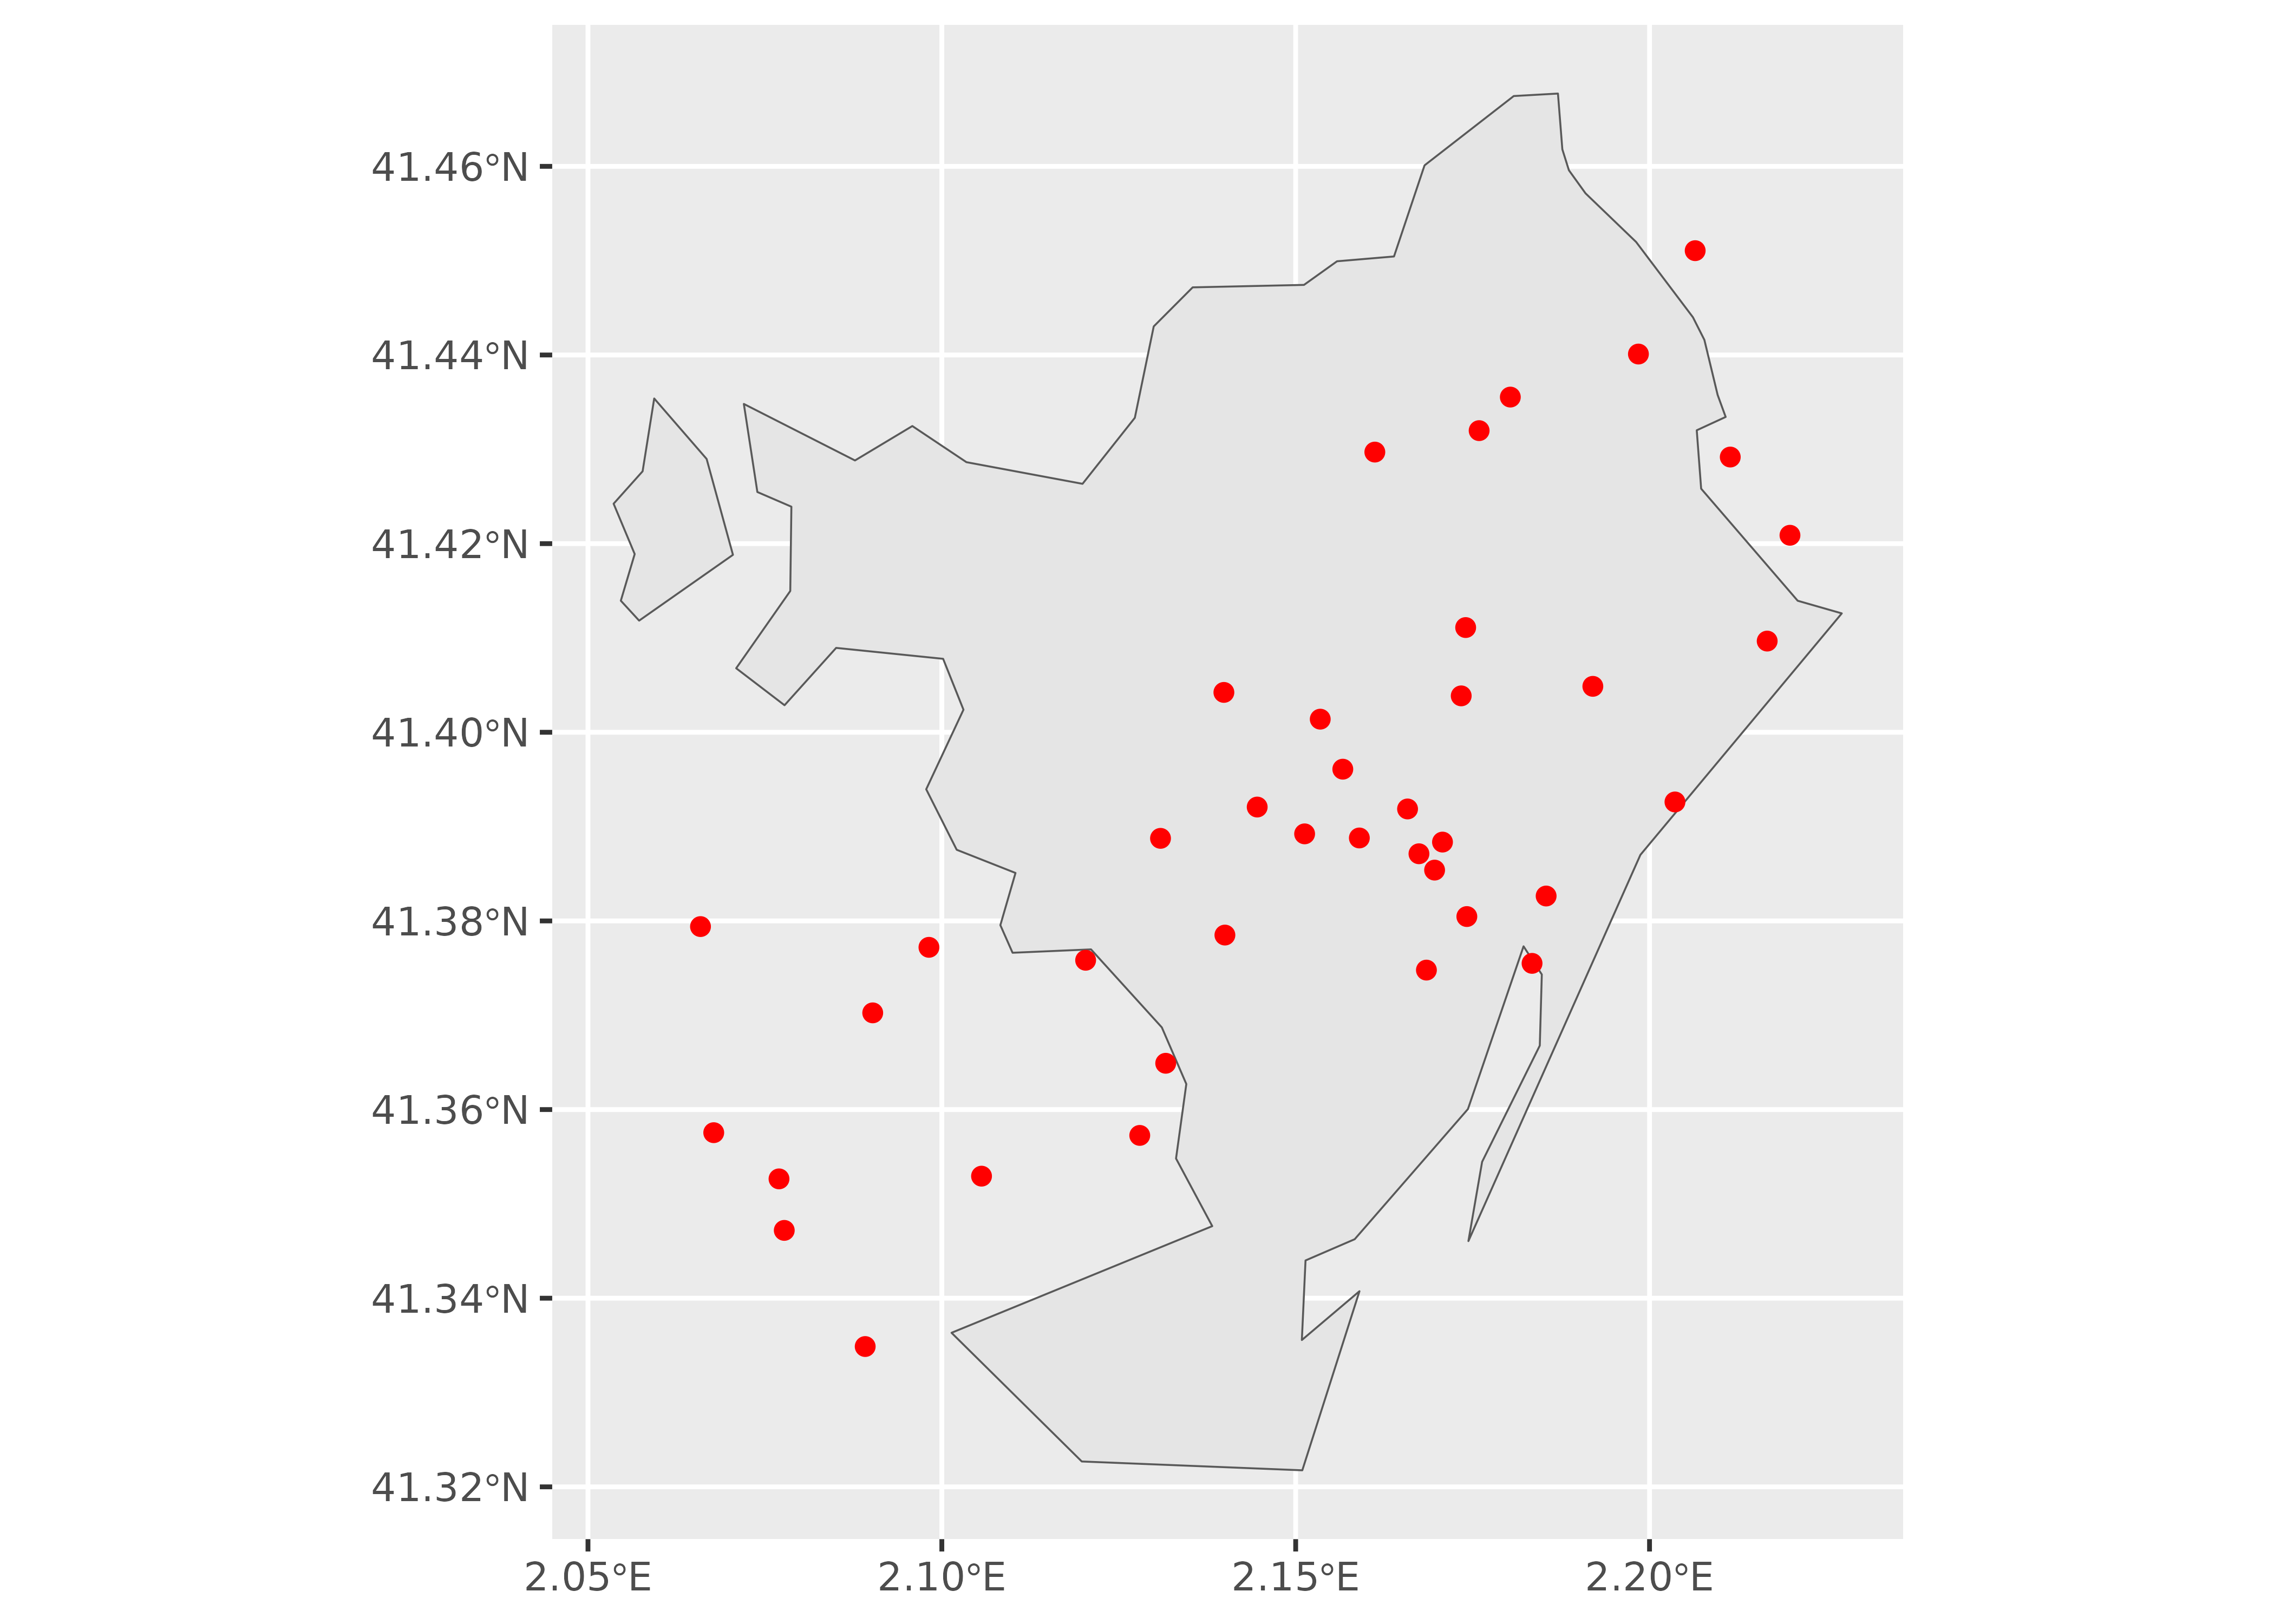
This example converts results from arcgeocoder into an sf object and displays them on a static map.
library(arcgeocoder)
library(dplyr)
library(sf) # Work with spatial objects.
library(ggplot2)
library(mapSpain) # Get municipality boundaries for Spain.

# McDonald's restaurants in Barcelona, Spain.

mc <- arc_geo_multi(
  "McDonalds",
  city = "Barcelona",
  region = "Catalonia",
  countrycode = "ES",
  category = "Food",
  limit = 50,
  custom_query = list(outFields = c("LongLabel", "Type", "StAddr"))
)

# Convert to an sf object.
mc_sf <- st_as_sf(
  mc,
  coords = c("lon", "lat"),
  # Use the WKID from the geocoding results.
  crs = mc$latestWkid[1]
)

bcn <- esp_get_munic(munic = "Barcelona") |>
  st_transform(mc$latestWkid[1])

ggplot(bcn) +
  geom_sf() +
  geom_sf(data = mc_sf, color = "red")
# Restrict results to the Barcelona bounding box in the query.
bbox <- st_bbox(bcn) |> paste0(collapse = ",")
bbox
#> [1] "2.0536216,41.3217545,2.227167,41.467717"

mc2_sf <- arc_geo_multi(
  "McDonalds",
  city = "Barcelona",
  region = "Catalonia",
  countrycode = "ES",
  category = "Food",
  limit = 50,
  custom_query = list(
    outFields = c("LongLabel", "Type", "StAddr"),
    searchExtent = bbox
  )
) |>
  st_as_sf(coords = c("lon", "lat"), crs = mc$latestWkid[1])

ggplot(bcn) +
  geom_sf() +
  geom_sf(data = mc2_sf, color = "red")
Example 2: Add map tiles
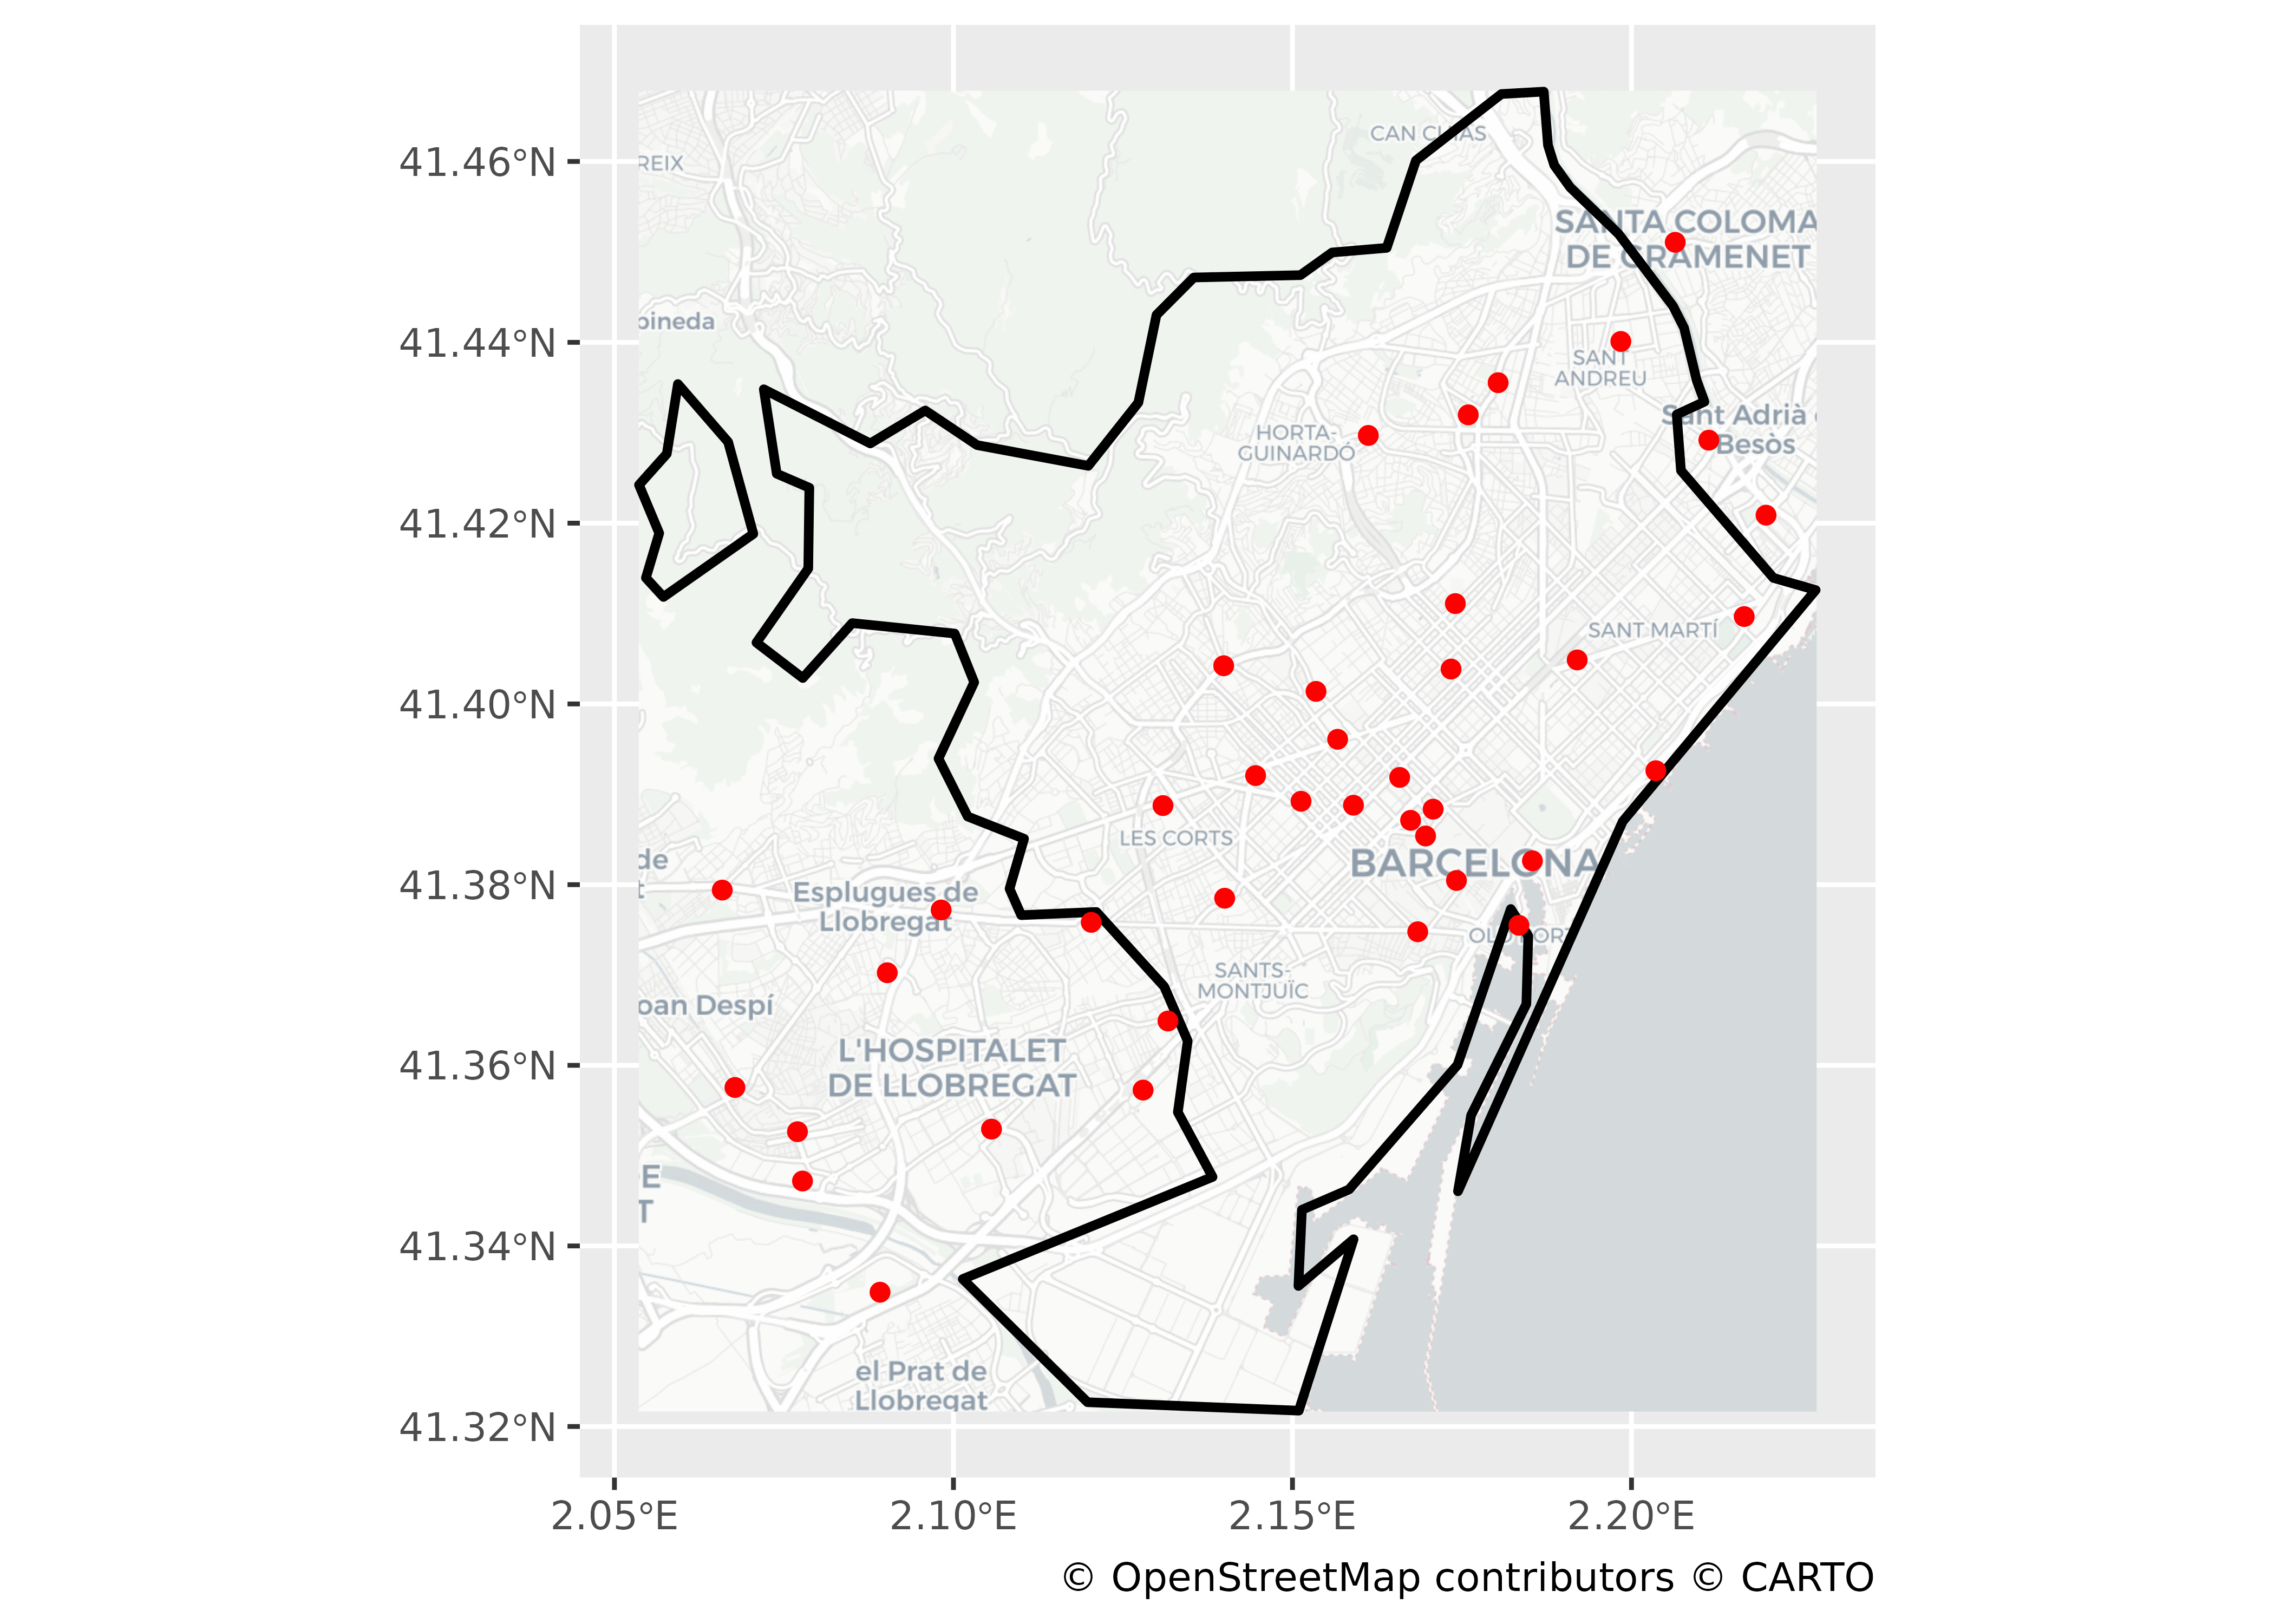
The maptiles package retrieves static map tiles as terra objects. The tidyterra package then adds the tiles to a ggplot2 map.