Why this package?
The geobounds package provides an R-friendly interface for downloading administrative boundaries from geoBoundaries, the Global Database of Political Administrative Boundaries. With geobounds, you can:
- Download individual country boundaries and global composite boundaries from geoBoundaries.
- Use tidyverse and sf workflows in R to map, analyze and join administrative boundaries with your own data.
- Work in an open-data context where attribution to geoBoundaries is required.
In short, if you work with administrative boundaries in R, geobounds simplifies downloading, cache management and integration with spatial data workflows.
Attribution is required when sharing geoBoundaries boundaries or derived products.
Example usage
library(geobounds)

sri_lanka_adm1 <- gb_get_adm1("Sri Lanka")
sri_lanka_adm2 <- gb_get_adm2("Sri Lanka")
sri_lanka_adm3 <- gb_get_adm3("Sri Lanka")

library(sf)
library(dplyr)

library(ggplot2)

ggplot(sri_lanka_adm3) +
  geom_sf(fill = "#DFDFDF", color = "white") +
  geom_sf(data = sri_lanka_adm2, fill = NA, color = "#F0B323") +
  geom_sf(data = sri_lanka_adm1, fill = NA, color = "black") +
  labs(
    caption = paste(
      "Sources: geoBoundaries, OpenStreetMap and Wambacher,",
      "license: ODbL 1.0"
    )
  ) +
  theme_void()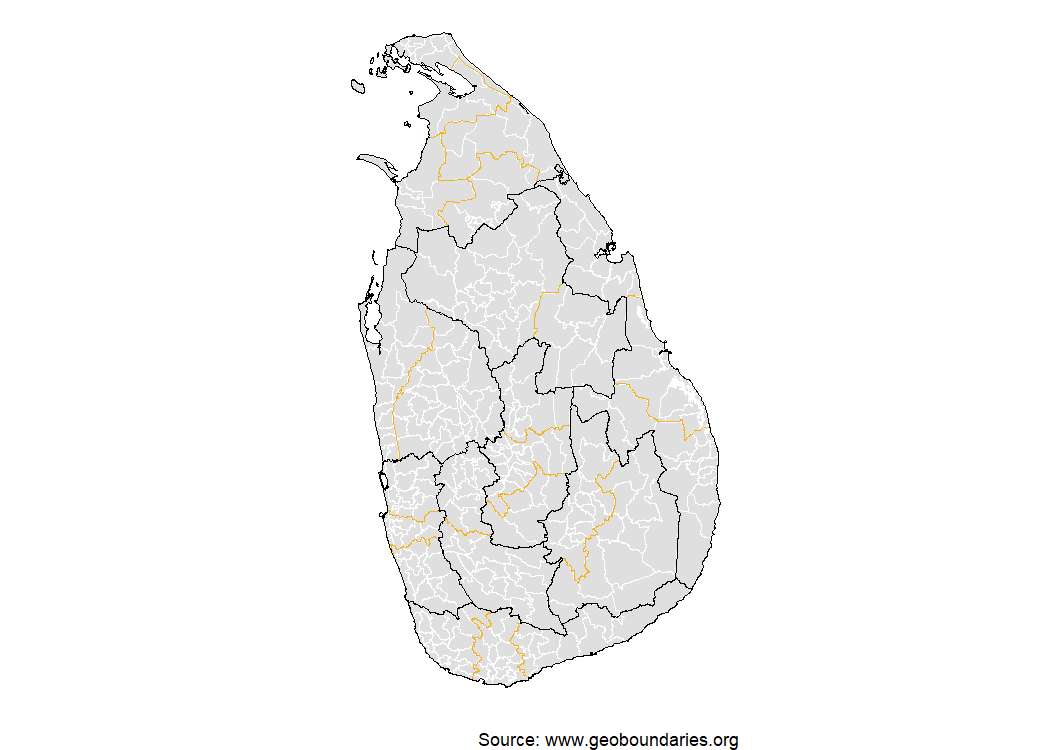
Release types
geoBoundaries provides three release types with different data sources, validation processes and licensing terms:
- gbOpen: Openly licensed boundaries suitable for most uses. The original license varies by boundary and may include ODbL, CC BY or CC BY-SA terms.
- gbHumanitarian: Boundaries mirrored from UN OCHA. Check the current metadata for the applicable source, license and attribution terms.
- gbAuthoritative: Boundaries mirrored from UN SALB and verified through in-country processes. These boundaries are restricted to non-commercial use.
Use the release_type argument to request a specific release type, for example, gb_get_adm1("Sri Lanka", release_type = "gbHumanitarian").
For coverage and boundary metadata by release type, see the geobounds articles.
Advanced usage
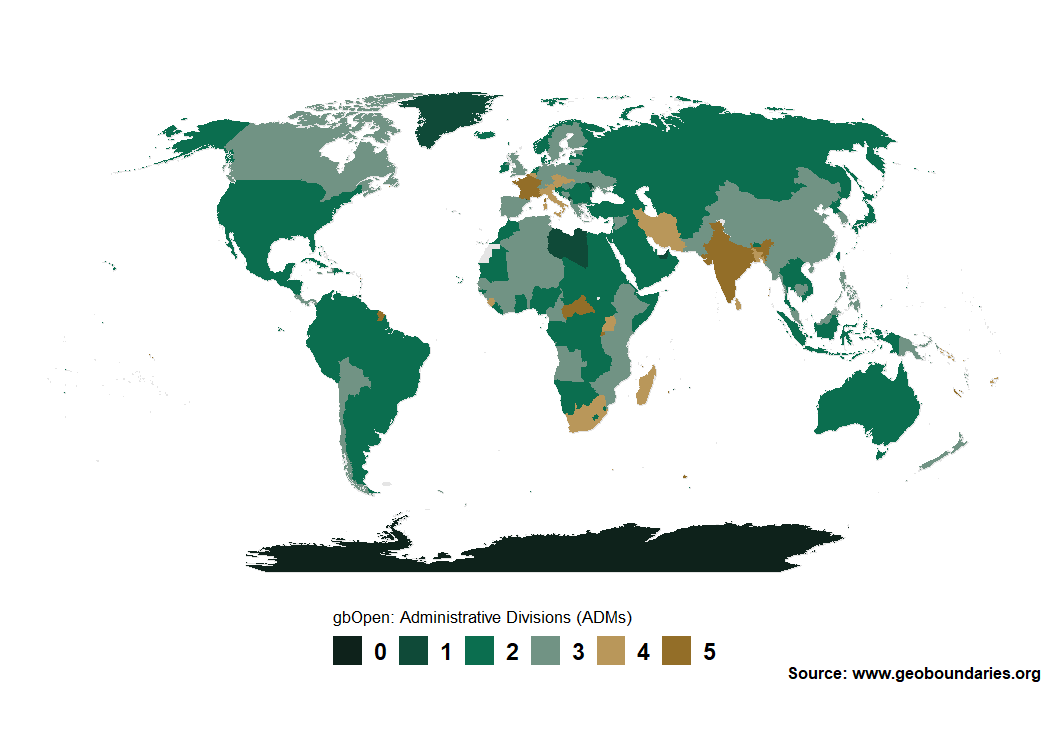
Map the highest available ADM level in geoBoundaries by country:
library(geobounds)
library(ggplot2)
library(dplyr)

world <- gb_get_world()
max_lvl <- gb_get_max_adm_lvl(release_type = "gbOpen")

world_max <- world |>
  mutate(boundaryISO = shapeGroup) |>
  left_join(max_lvl) |>
  mutate(max_lvl = factor(maxBoundaryType, levels = 0:5))

pal <- c("#0e221b", "#0f4a38", "#0b6e4f", "#719384", "#b9975a", "#936e28")
names(pal) <- levels(world_max$max_lvl)

ggplot(world_max) +
  geom_sf(fill = "#e5e5e5", color = "#e5e5e5") +
  geom_sf(aes(fill = max_lvl), color = "transparent") +
  scale_fill_manual(values = pal, na.translate = FALSE, drop = FALSE) +
  guides(fill = guide_legend(direction = "horizontal", nrow = 1)) +
  coord_sf(expand = TRUE, crs = "+proj=robin") +
  theme_void() +
  theme(
    plot.background = element_rect(fill = "white", color = NA),
    text = element_text(family = "sans", face = "bold"),
    legend.position = "bottom",
    legend.title.position = "top",
    legend.title = element_text(size = rel(0.75), face = "plain"),
    legend.text = element_text(size = rel(1)),
    legend.text.position = "right",
    legend.key.height = unit(1, "line"),
    legend.key.width = unit(1, "line"),
    plot.caption = element_text(
      size = rel(0.7),
      margin = margin(r = 4)
    )
  ) +
  labs(
    fill = "gbOpen: Highest available ADM level",
    caption = "Source: geoBoundaries (CGAZ and gbOpen metadata)"
  )
Documentation and resources
- Visit the pkgdown site for full documentation: https://dieghernan.github.io/geobounds/
- Articles on geoBoundaries release types:
- Explore the geoBoundaries homepage: https://www.geoboundaries.org/
- Read the original paper describing the geoBoundaries dataset (Runfola et al. 2020).
- Report issues or contribute on GitHub.
License
The geobounds software is released under the MIT license. This license does not cover boundaries downloaded through the package or figures derived from those boundaries.
Each boundary retains the original license reported by geoBoundaries. Before reusing or redistributing boundaries, use gb_get_metadata() to check boundaryLicense, licenseDetail, licenseSource, boundarySource and boundarySourceURL. Attribute geoBoundaries and the original providers, include the applicable license and indicate modifications when required. gbAuthoritative contains UN SALB boundaries restricted to non-commercial use.
Acknowledgments
- Thanks to the geoBoundaries team and the William & Mary geoLab for creating and maintaining the dataset.
- Thanks to the R package community and all geobounds contributors.
- If you use geobounds with geoBoundaries boundaries, please cite both.
Citation
Hernangómez D (2026). geobounds: Download Administrative Boundary Data from geoBoundaries. doi:10.32614/CRAN.package.geobounds. https://dieghernan.github.io/geobounds/.
A BibTeX entry for LaTeX users:
@Manual{R-geobounds,
  title = {{geobounds}: Download Administrative Boundary Data from geoBoundaries},
  author = {Diego Hernangómez},
  year = {2026},
  version = {1.0.0},
  url = {https://dieghernan.github.io/geobounds/},
  abstract = {Provides tools to download individual country boundaries and global composite boundaries from geoBoundaries <https://www.geoboundaries.org/> across multiple administrative (ADM) levels. Returns boundaries as sf objects for mapping and spatial analysis. Runfola et al. (2020) <doi:10.1371/journal.pone.0231866> describe the underlying database.},
  doi = {10.32614/CRAN.package.geobounds},
}