This article shows several ways to plot the SpatRaster object returned by rasterpic_img().
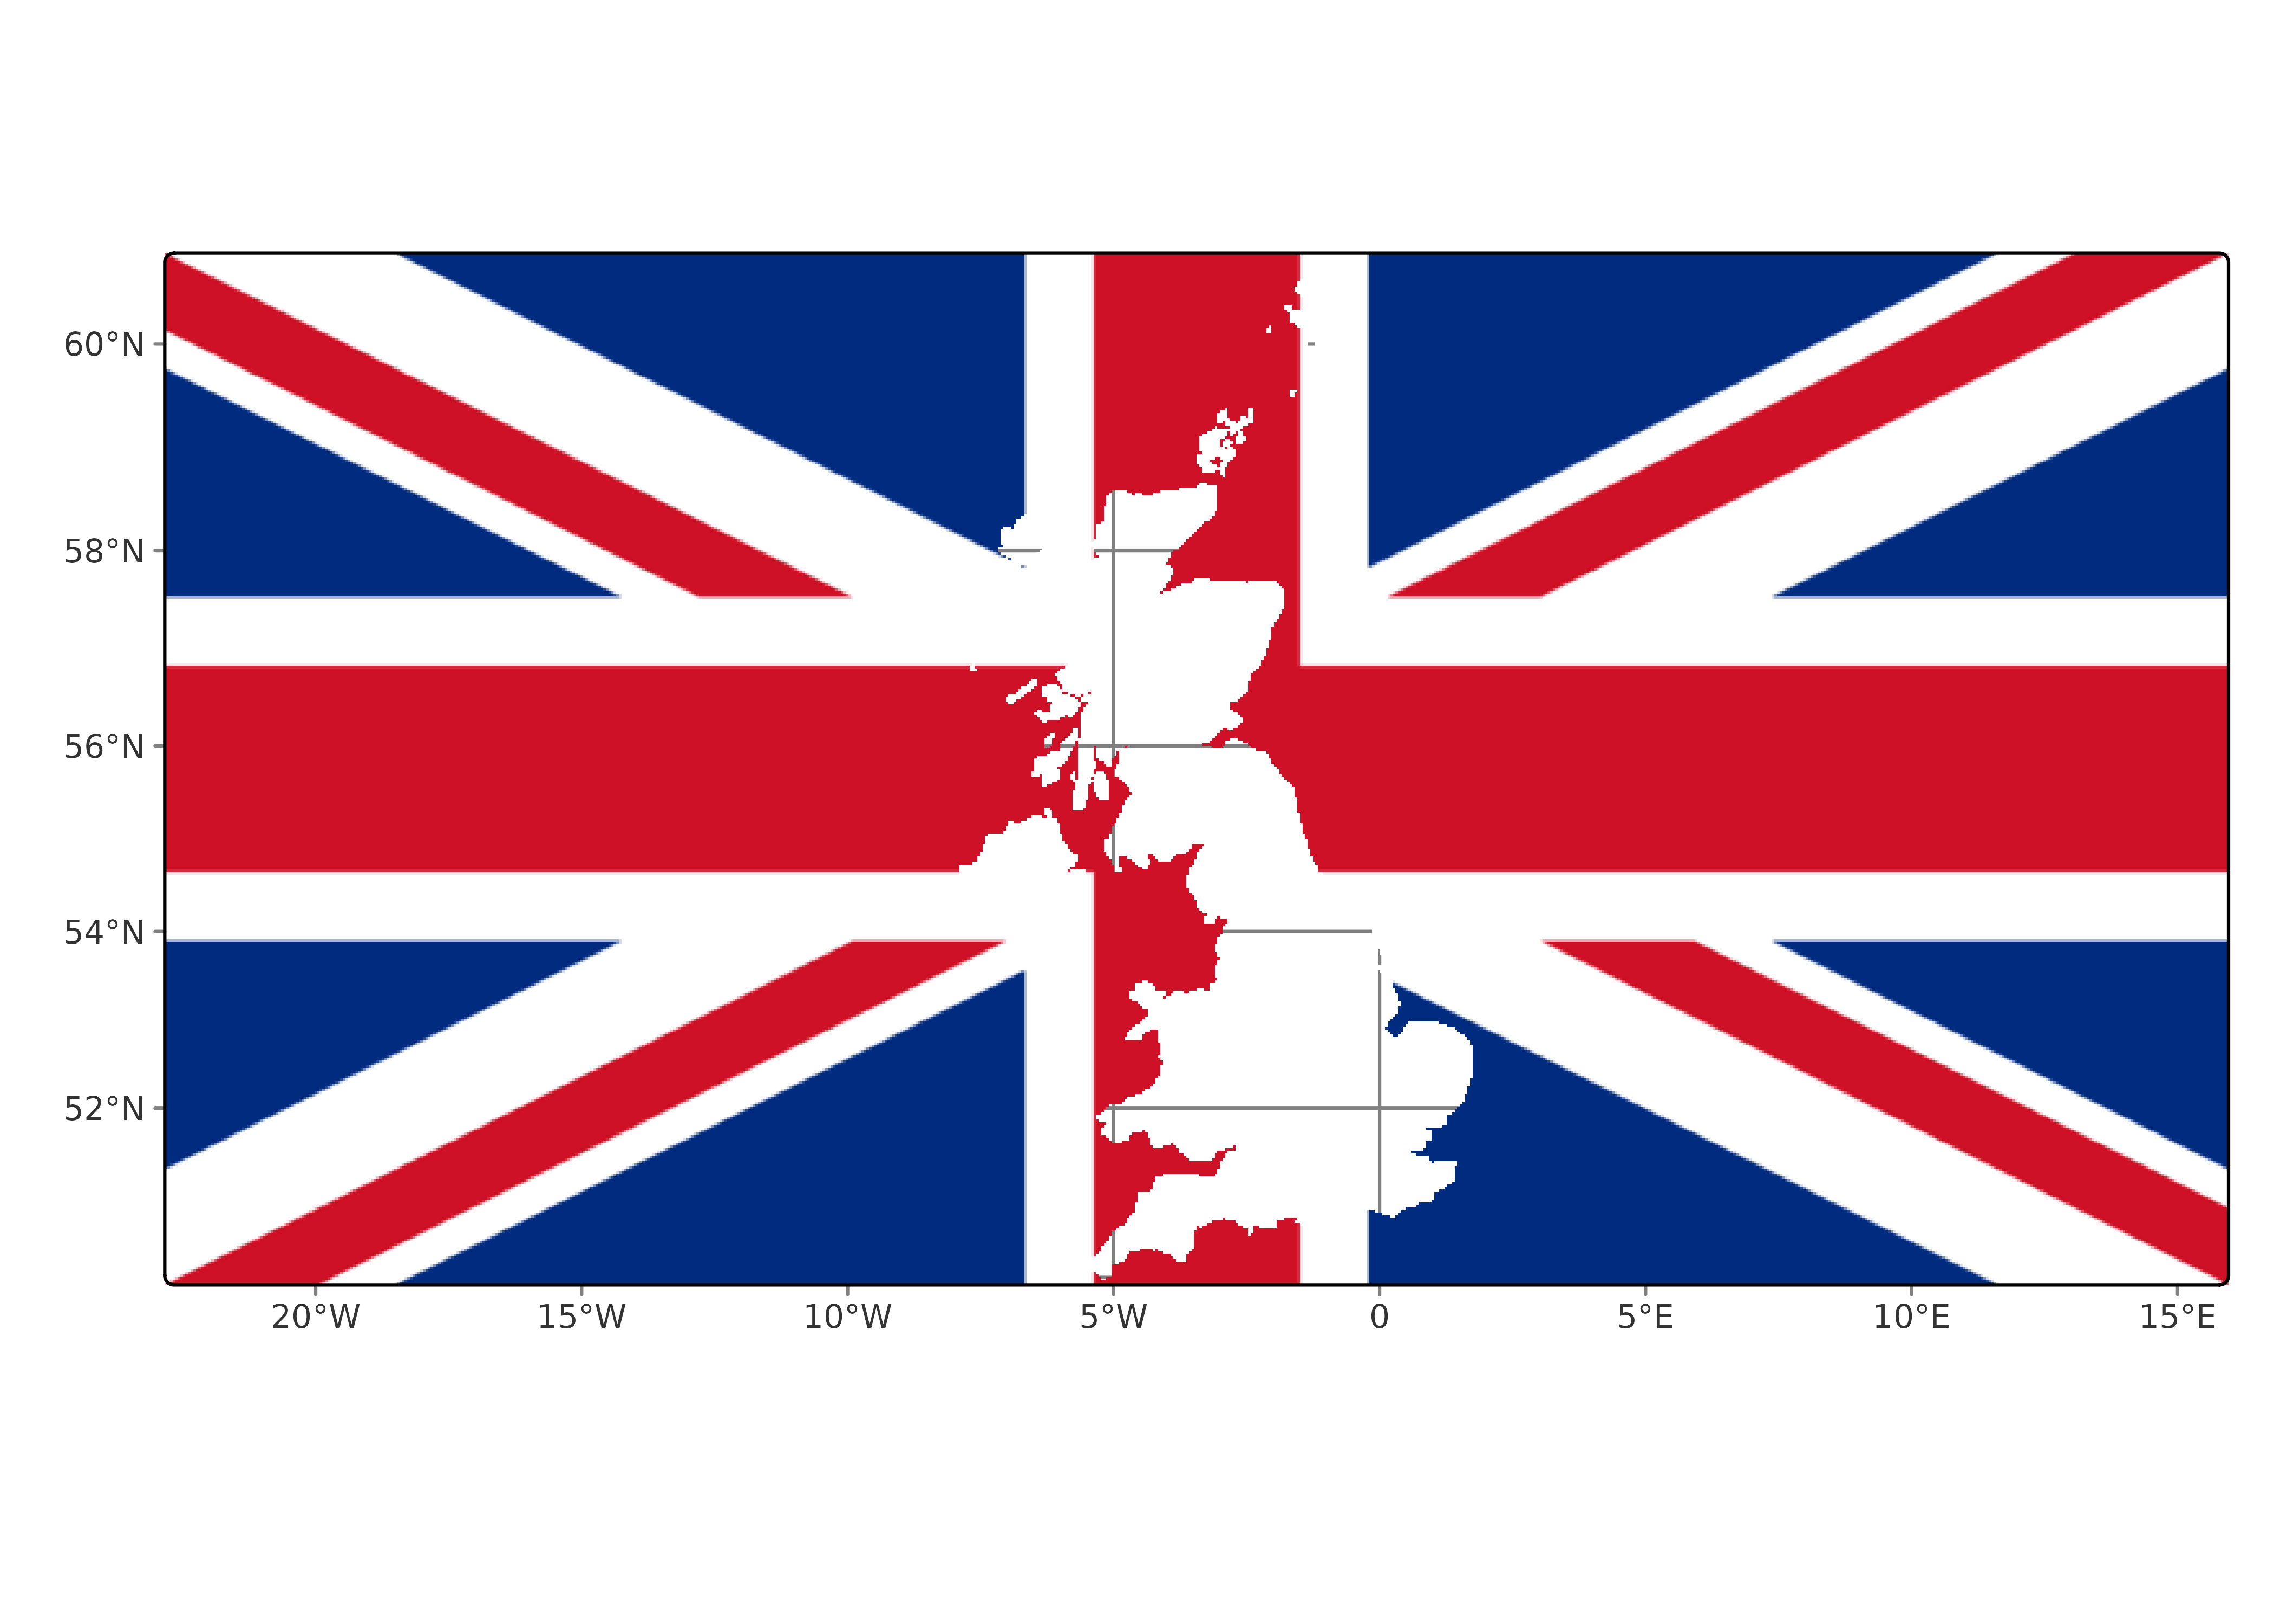
Base plots
The most direct option is to use the base plot() methods provided by the terra package, such as terra::plotRGB():
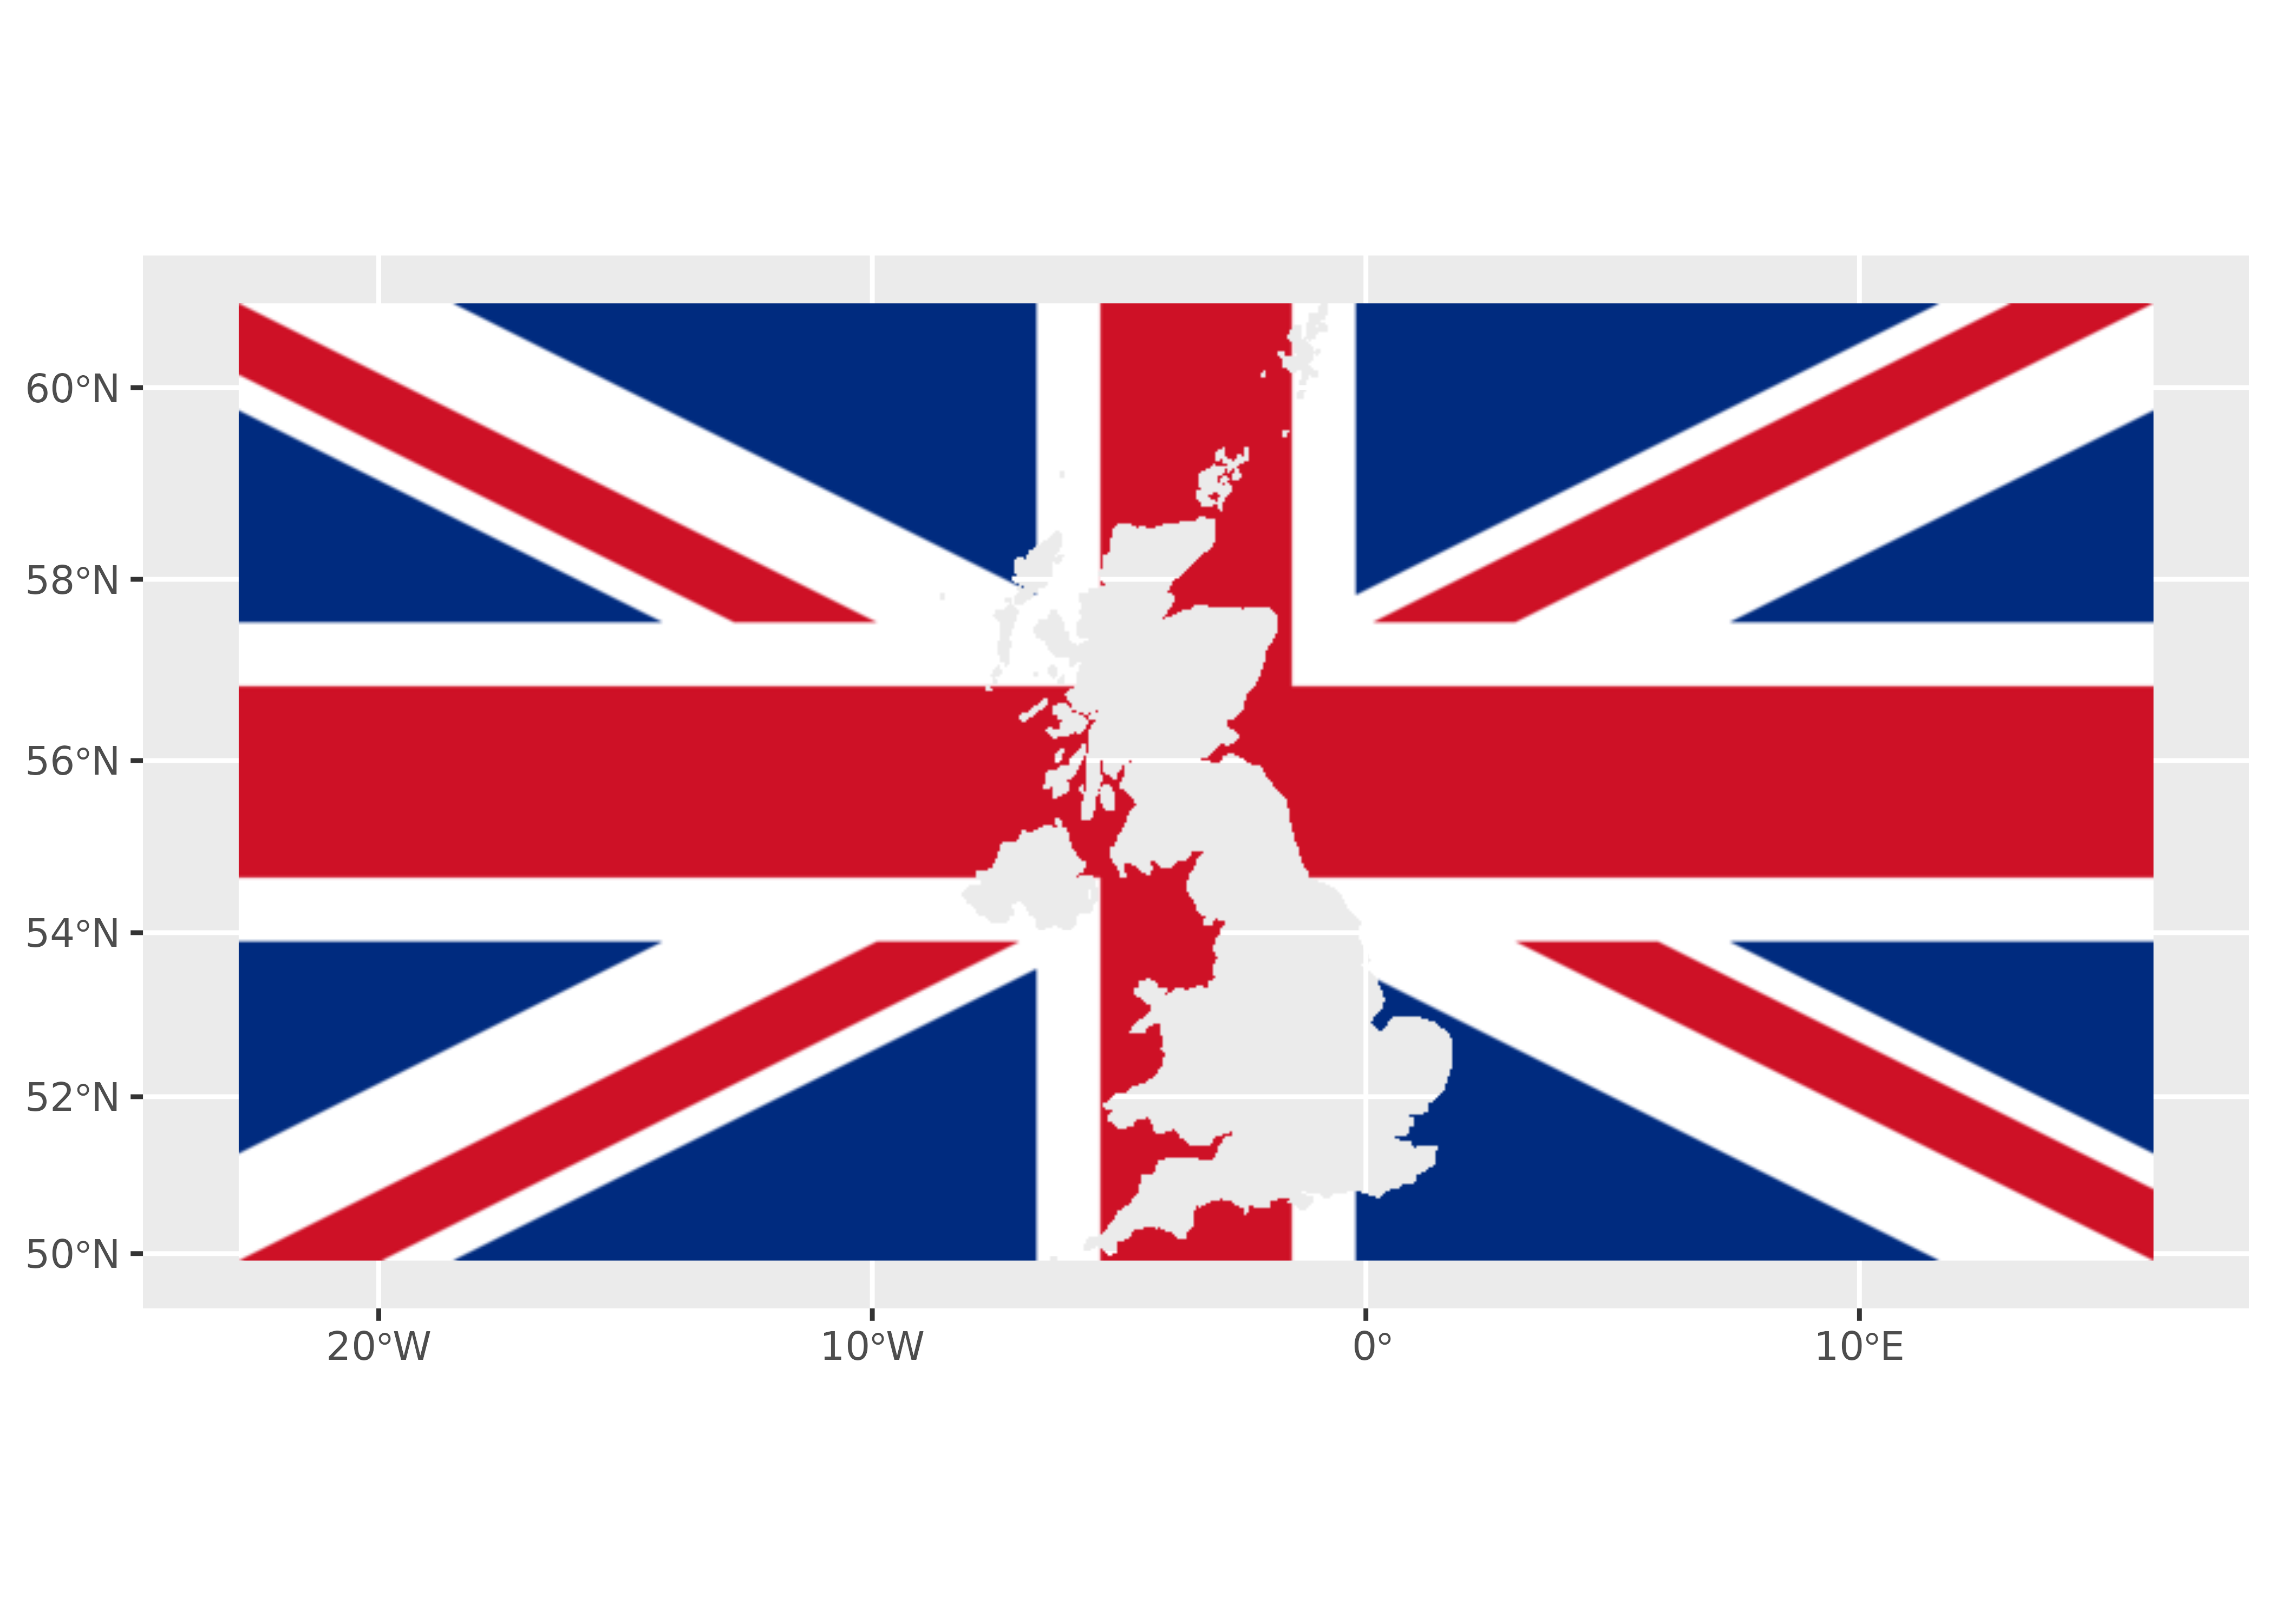
With ggplot2 and tidyterra
The tidyterra package provides ggplot2 support for terra SpatRaster objects:
With tmap
The tmap package can also create maps from SpatRaster objects:
With mapsf
The mapsf package can also plot SpatRaster objects:
With maptiles
The maptiles package can download map tiles from different providers. It also provides functions for plotting terra SpatRaster objects: