Count the observations in each SpatVector group
Source: R/count-tally-SpatVector.R
count.SpatVector.Rdcount() lets you quickly count the unique values of one or more variables:
df |> count(a, b) is roughly equivalent to
df |> group_by(a, b) |> summarise(n = n()). count() is paired with
tally(), a lower-level helper that is equivalent to
df |> summarise(n = n()). Supply wt to perform weighted counts,
switching the summary from n = n() to n = sum(wt).
add_count() is equivalent to count() but uses mutate() instead of
summarise() so that it adds a new column with group-wise counts.
Usage
# S3 method for class 'SpatVector'
count(
  x,
  ...,
  wt = NULL,
  sort = FALSE,
  name = NULL,
  .drop = deprecated(),
  .dissolve = TRUE
)

# S3 method for class 'SpatVector'
tally(x, wt = NULL, sort = FALSE, name = NULL)

# S3 method for class 'SpatVector'
add_count(x, ..., wt = NULL, sort = FALSE, name = NULL, .drop = deprecated())
Arguments
- x
A
SpatVectorcreated withterra::vect().- ...
<
data-masking> Variables to group by.- wt
<
data-masking> Frequency weights. Can beNULLor a variable:If
NULL(the default), counts the number of rows in each group.If a variable, computes
sum(wt)for each group.
- sort
If
TRUE, will show the largest groups at the top.- name
The name of the new column in the output.
If omitted, it will default to
n. If there's already a column calledn, it will usenn. If there's a column callednandnn, it'll usennn, and so on, addingns until it gets a new name.- .drop
![[Deprecated]](figures/lifecycle-deprecated.svg) Argument no longer
supported, empty groups are always removed (see
Argument no longer
supported, empty groups are always removed (see dplyr::count(),.drop = TRUEargument).- .dissolve
Logical. If
TRUE, dissolve borders between aggregated geometries.
terra equivalent
Methods
Implementation of the generic dplyr::count() method family for
SpatVector objects.
tally() will always return a disaggregated geometry while count() can
handle this. See also summarise.SpatVector().
See also
dplyr::count(), dplyr::tally().
Other dplyr verbs that operate on groups of rows:
group_by.SpatVector(),
reframe.SpatVector(),
rowwise.SpatVector(),
summarise.SpatVector()
Examples
# \donttest{
library(terra)
f <- system.file("ex/lux.shp", package = "terra")
p <- vect(f)
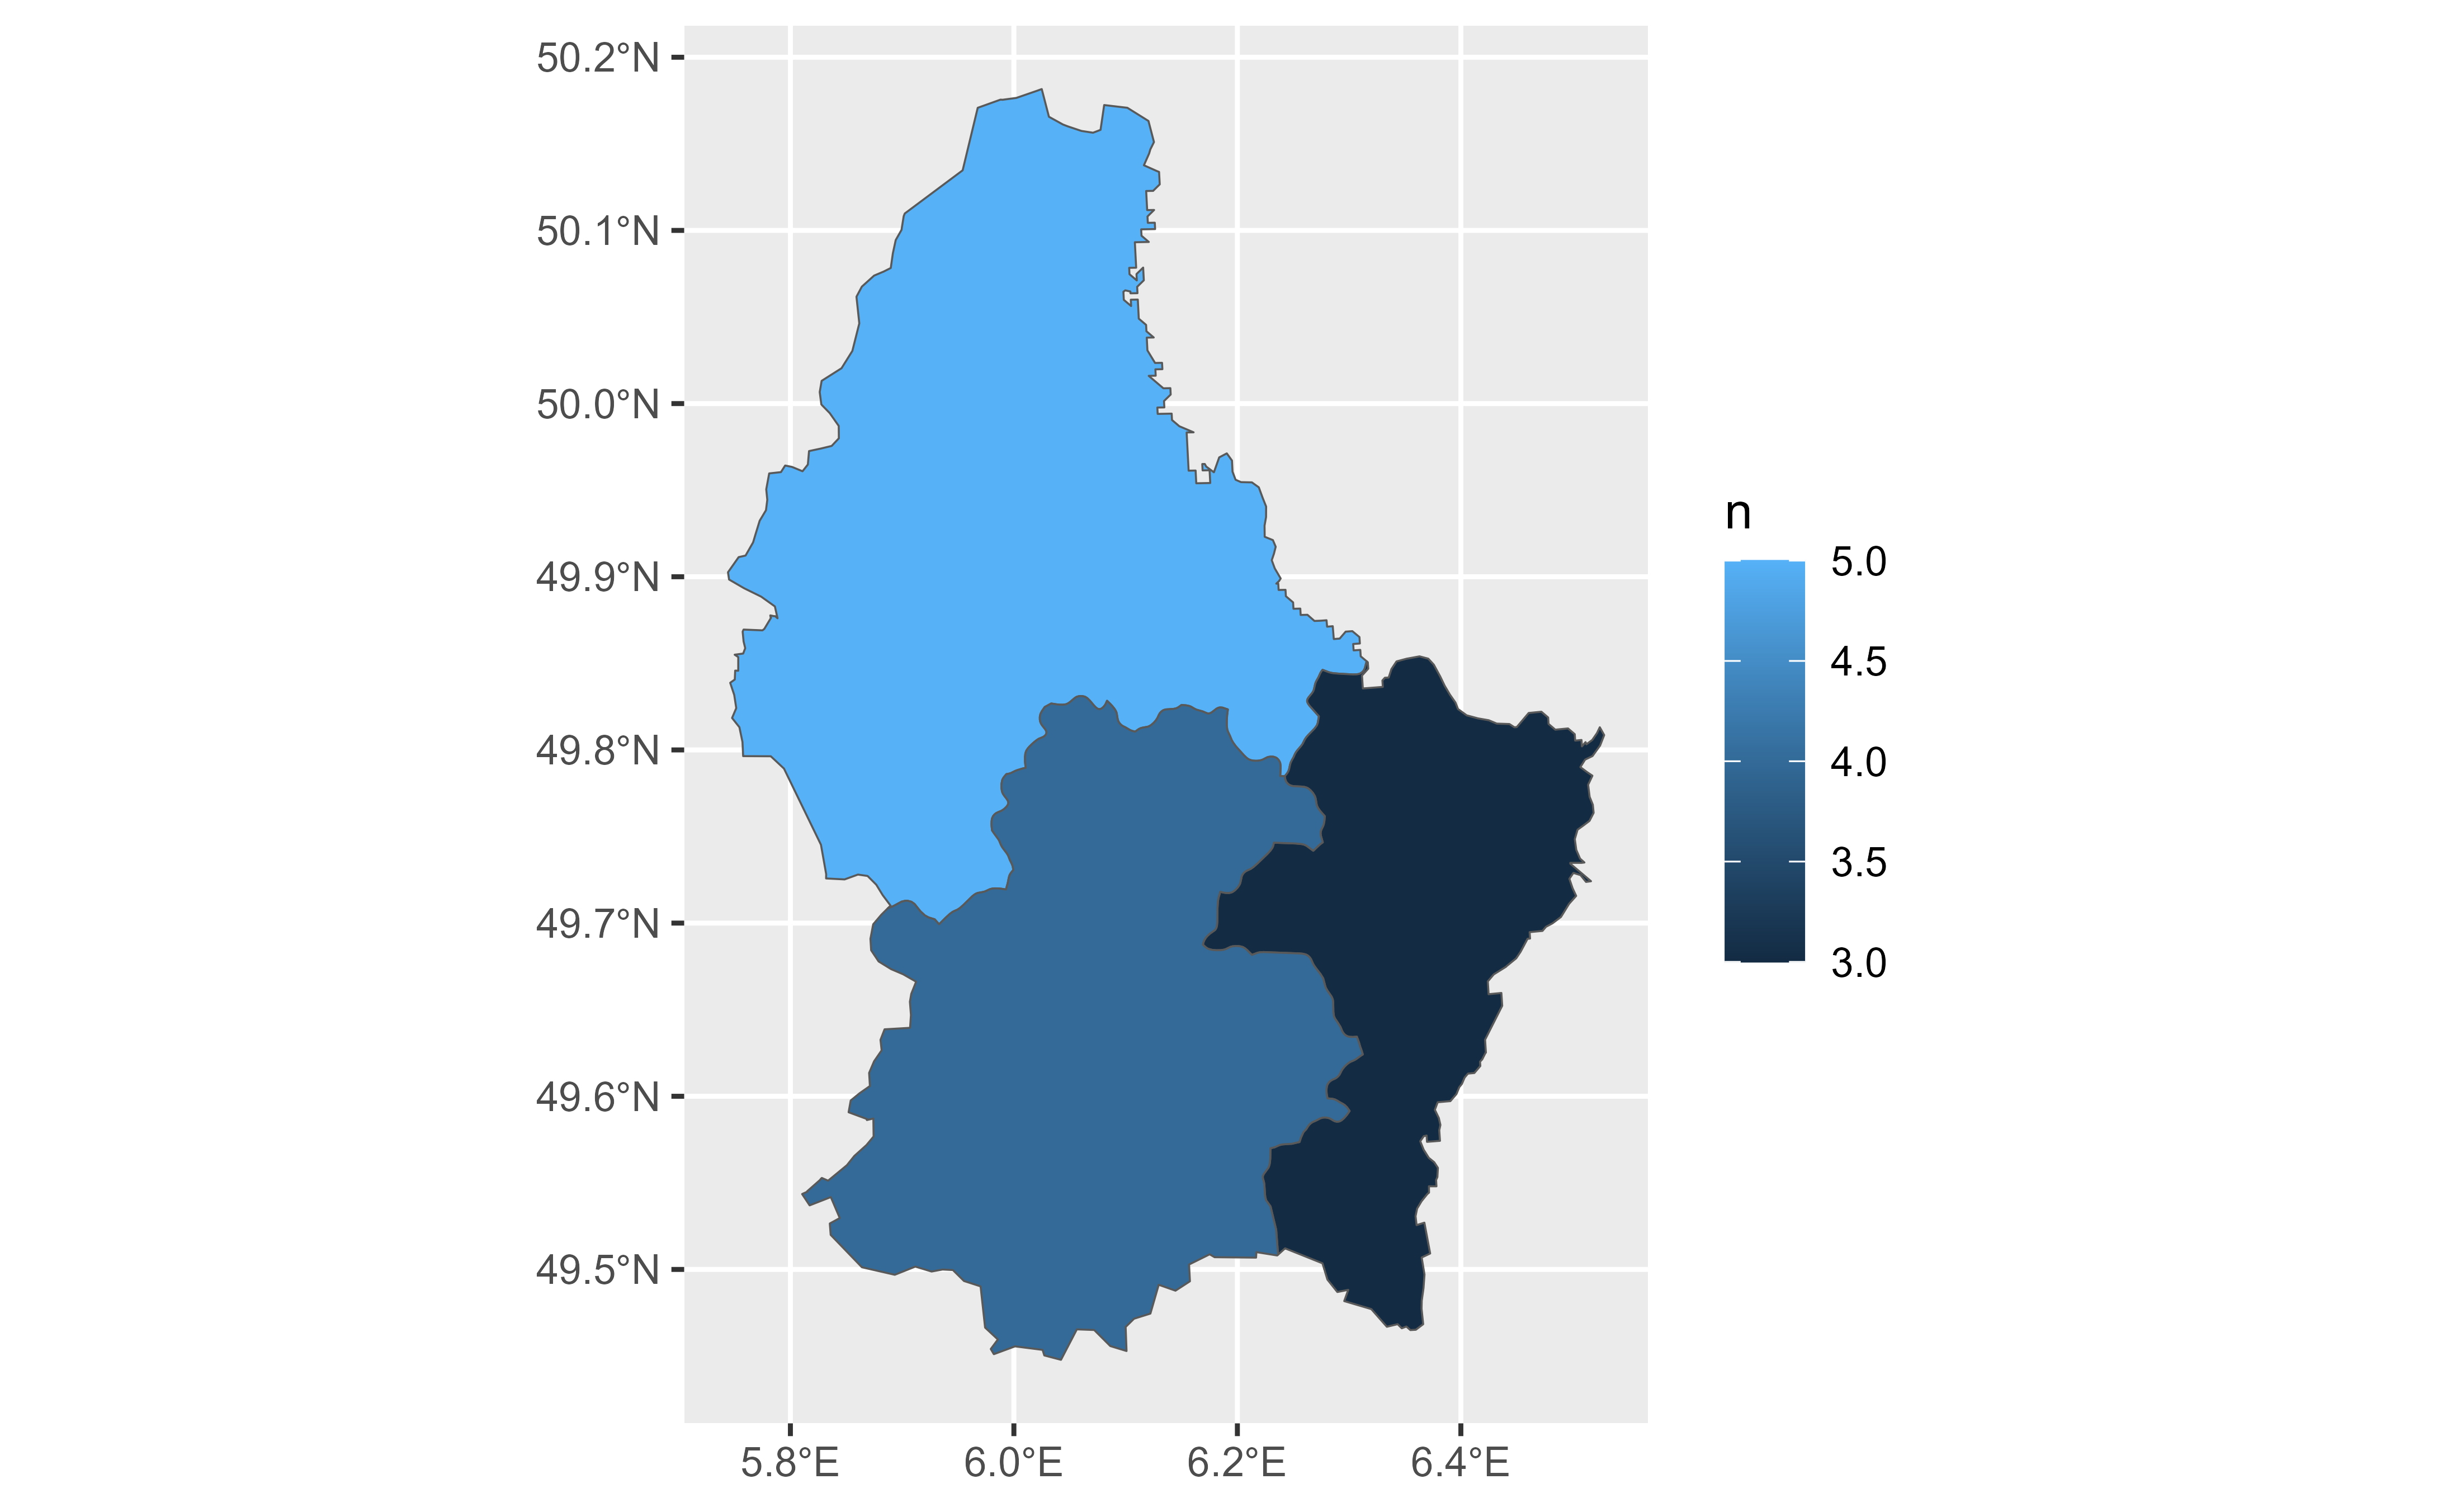
p |> count(NAME_1, sort = TRUE)
#> class : SpatVector
#> geometry : polygons
#> dimensions : 3, 2 (geometries, attributes)
#> extent : 5.74414, 6.528252, 49.44781, 50.18162 (xmin, xmax, ymin, ymax)
#> coord. ref. : lon/lat WGS 84 (EPSG:4326)
#> names : NAME_1 n
#> type : <chr> <int>
#> values : Diekirch 5
#> Luxembourg 4
#> Grevenmacher 3
p |> count(pop = ifelse(POP < 20000, "A", "B"))
#> class : SpatVector
#> geometry : polygons
#> dimensions : 2, 2 (geometries, attributes)
#> extent : 5.74414, 6.528252, 49.44781, 50.18162 (xmin, xmax, ymin, ymax)
#> coord. ref. : lon/lat WGS 84 (EPSG:4326)
#> names : pop n
#> type : <chr> <int>
#> values : A 5
#> B 7
# tally() is a lower-level function that assumes grouping is already done.
p |> tally()
#> class : SpatVector
#> geometry : polygons
#> dimensions : 1, 1 (geometries, attributes)
#> extent : 5.74414, 6.528252, 49.44781, 50.18162 (xmin, xmax, ymin, ymax)
#> coord. ref. : lon/lat WGS 84 (EPSG:4326)
#> names : n
#> type : <int>
#> values : 12
p |>
group_by(NAME_1) |>
tally()
#> class : SpatVector
#> geometry : polygons
#> dimensions : 3, 2 (geometries, attributes)
#> extent : 5.74414, 6.528252, 49.44781, 50.18162 (xmin, xmax, ymin, ymax)
#> coord. ref. : lon/lat WGS 84 (EPSG:4326)
#> names : NAME_1 n
#> type : <chr> <int>
#> values : Diekirch 5
#> Grevenmacher 3
#> Luxembourg 4
# Dissolve geometries by default
library(ggplot2)
p |>
count(NAME_1) |>
ggplot() +
geom_spatvector(aes(fill = n))
 # Opt out
p |>
count(NAME_1, .dissolve = FALSE, sort = TRUE) |>
ggplot() +
geom_spatvector(aes(fill = n))
# Opt out
p |>
count(NAME_1, .dissolve = FALSE, sort = TRUE) |>
ggplot() +
geom_spatvector(aes(fill = n))
 # }
# }