Summarise each group of a SpatVector down to one geometry
Source: R/summarise-SpatVector.R
summarise.SpatVector.Rdsummarise() creates a new SpatVector. It returns one geometry for each
combination of grouping variables. If there are no grouping variables, the
output will have a single geometry summarizing all observations in the input
and combining all the geometries of the SpatVector. It will contain one
column for each grouping variable and one column for each of
the summary statistics that you have specified.
summarise.SpatVector() and summarize.SpatVector() are synonyms.
Arguments
- .data
A
SpatVectorcreated withterra::vect().- ...
<
data-masking> Name-value pairs of summary functions. The name will be the name of the variable in the result.The value can be:
A vector of length 1, e.g.
min(x),n(), orsum(is.na(y)).A data frame with 1 row, to add multiple columns from a single expression.
- .by
<
tidy-select> Optionally, a selection of columns to group by for just this operation, functioning as an alternative togroup_by(). For details and examples, see ?dplyr_by.- .groups
![[Experimental]](figures/lifecycle-experimental.svg) Grouping structure of the
result.
Grouping structure of the
result."drop_last": drops the last level of grouping. This was the only supported option before version 1.0.0."drop": All levels of grouping are dropped."keep": Same grouping structure as.data."rowwise": Each row is its own group.
When
.groupsis not specified, it is set to"drop_last"for a grouped data frame, and"keep"for a rowwise data frame. In addition, a message informs you of how the result will be grouped unless the result is ungrouped, the option"dplyr.summarise.inform"is set toFALSE, or whensummarise()is called from a function in a package.- .dissolve
Logical. If
TRUE, dissolve borders between aggregated geometries.
terra equivalent
Methods
Implementation of the generic dplyr::summarise() method for
SpatVector objects.
As in the sf implementation, this function can dissolve geometries
with .dissolve = TRUE or create MULTI geometries with
.dissolve = FALSE. See Examples.
See also
dplyr::summarise(), terra::aggregate().
Other dplyr verbs that operate on groups of rows:
count.SpatVector(),
group_by.SpatVector(),
reframe.SpatVector(),
rowwise.SpatVector()
Examples
library(terra)
library(ggplot2)
v <- vect(system.file("extdata/cyl.gpkg", package = "tidyterra"))
# Grouped
gr_v <- v |>
mutate(start_with_s = startsWith(name, "S")) |>
group_by(start_with_s)
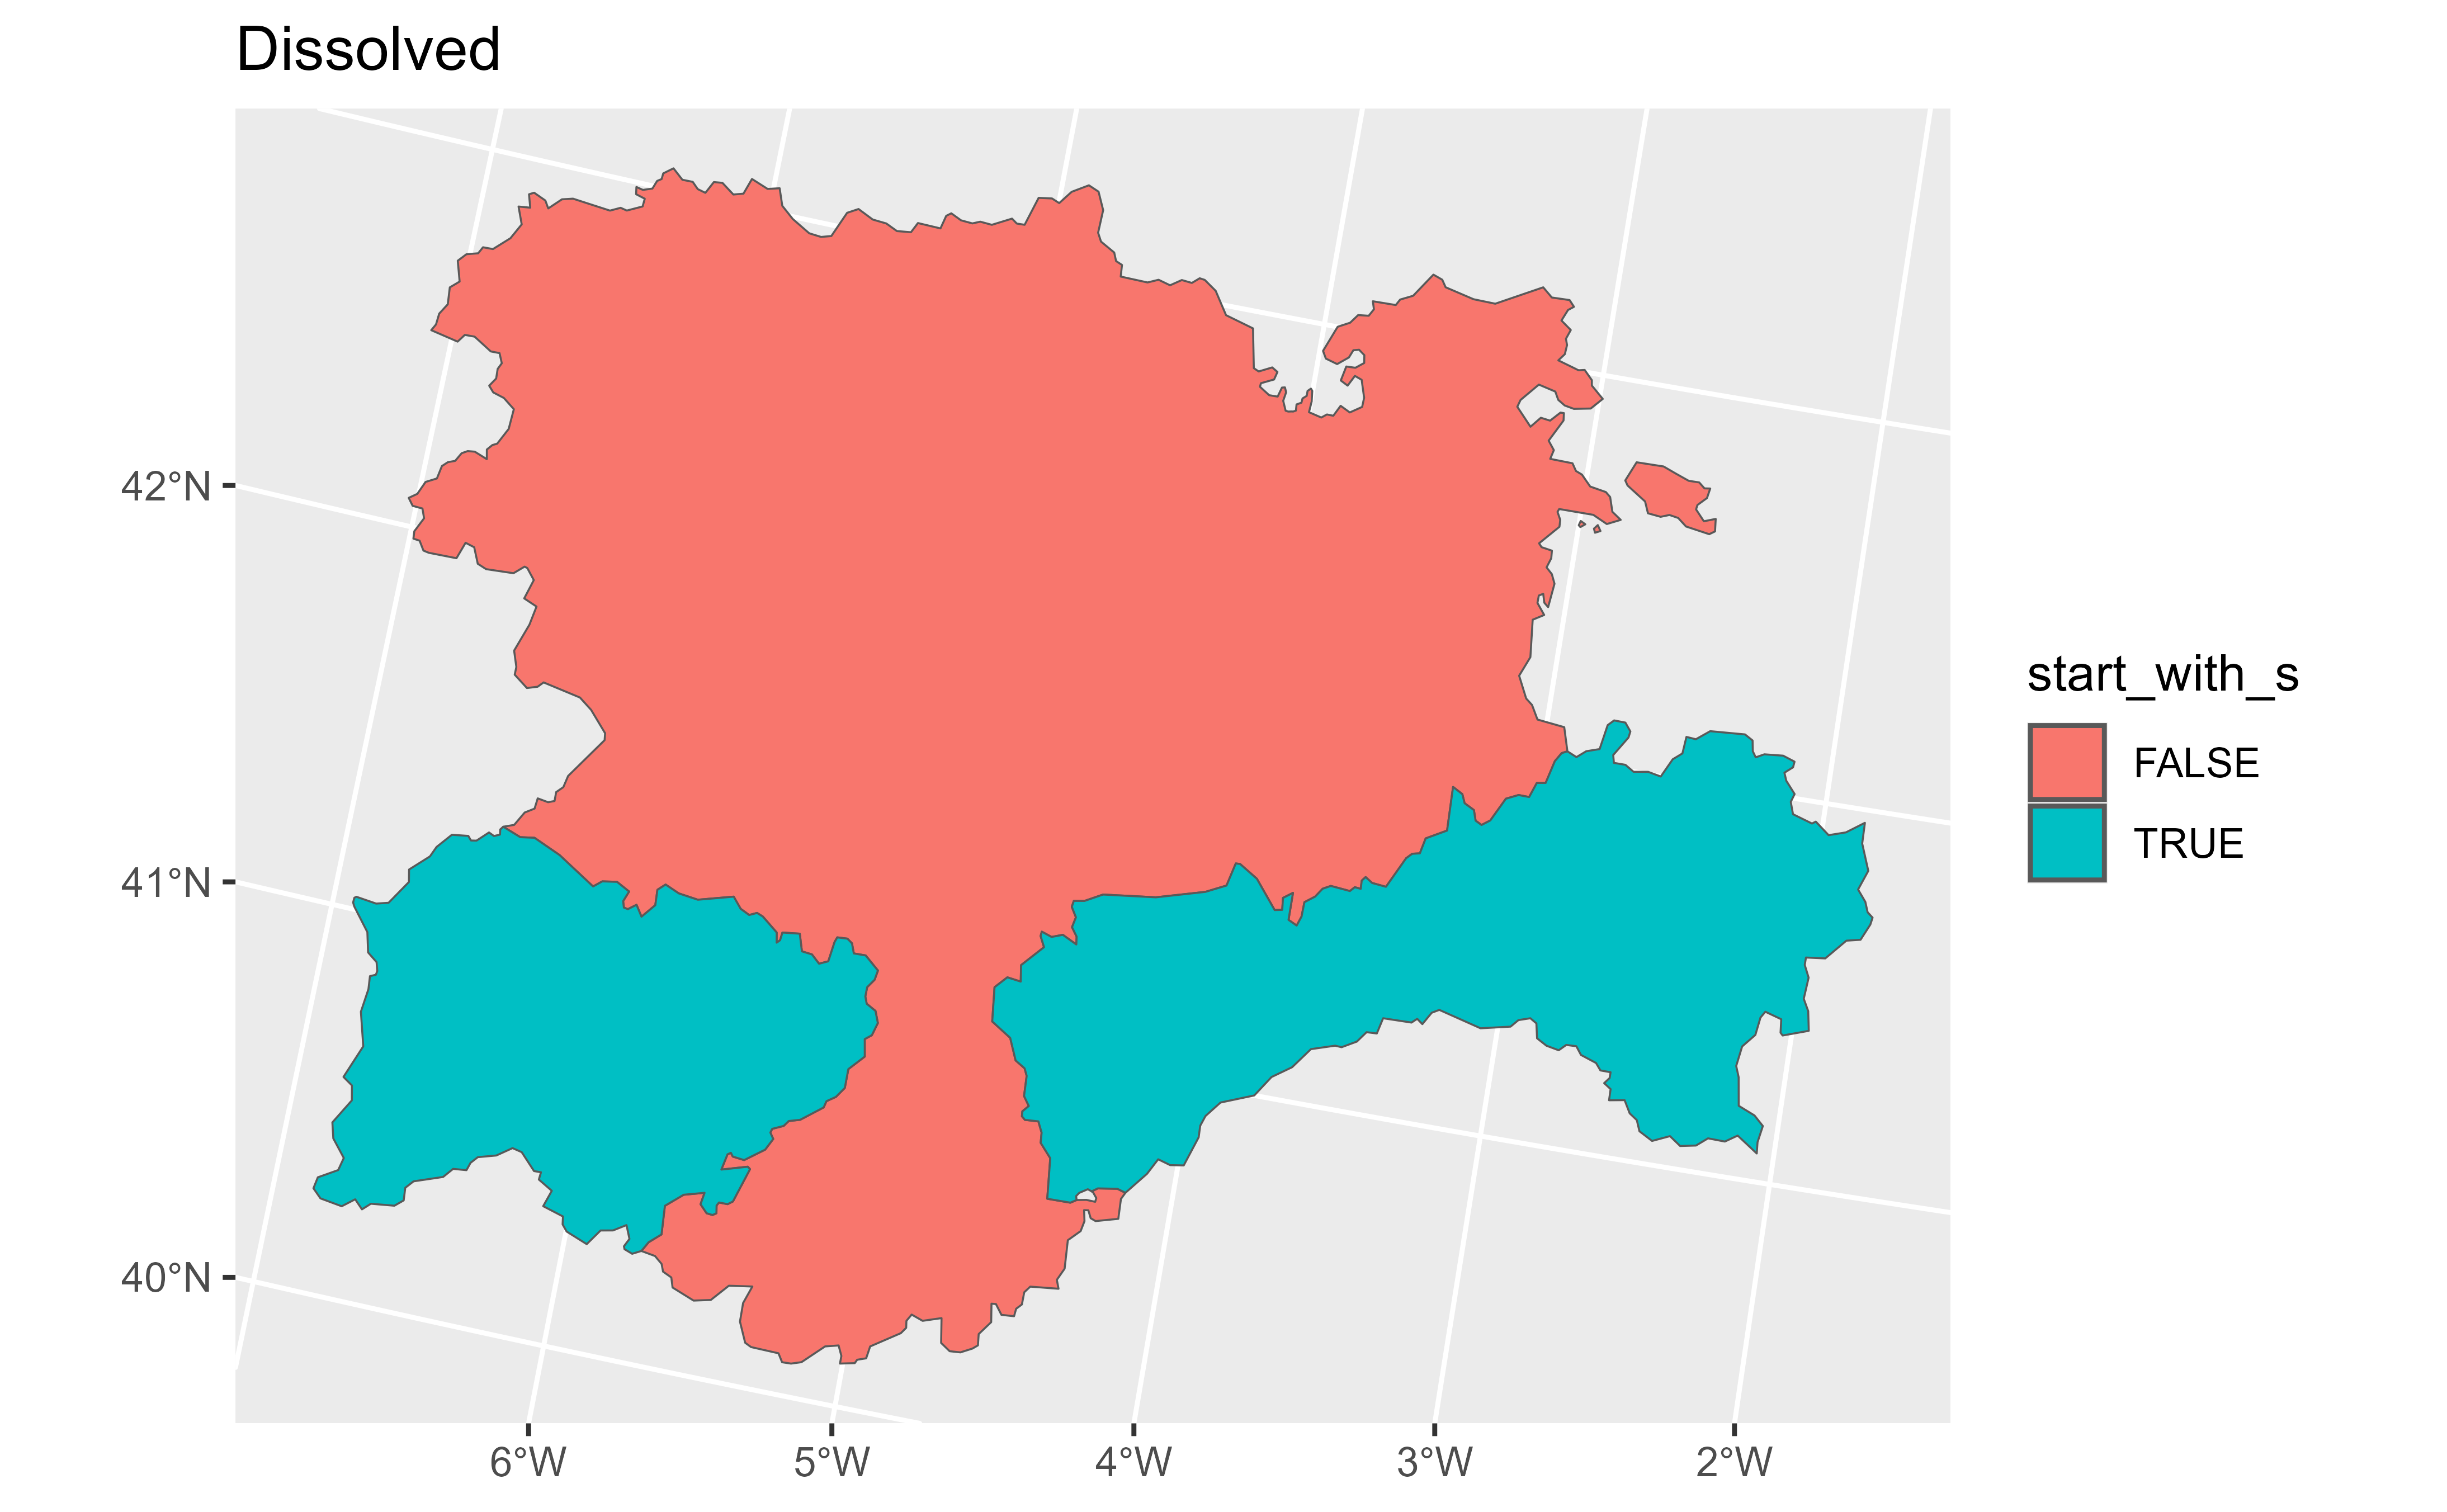
# Dissolve geometries.
diss <- gr_v |>
summarise(n = dplyr::n(), mean = mean(as.double(cpro)))
diss
#> class : SpatVector
#> geometry : polygons
#> dimensions : 2, 3 (geometries, attributes)
#> extent : 2892687, 3341372, 2017622, 2361600 (xmin, xmax, ymin, ymax)
#> coord. ref. : ETRS89-extended / LAEA Europe (EPSG:3035)
#> names : start_with_s n mean
#> type : <lgl> <int> <num>
#> values : FALSE 6 28
#> TRUE 3 39.6667
autoplot(diss, aes(fill = start_with_s)) +
ggplot2::labs(title = "Dissolved")
 # Keep geometries separate.
no_diss <- gr_v |>
summarise(n = dplyr::n(), mean = mean(as.double(cpro)), .dissolve = FALSE)
# Same statistic.
no_diss
#> class : SpatVector
#> geometry : polygons
#> dimensions : 2, 3 (geometries, attributes)
#> extent : 2892687, 3341372, 2017622, 2361600 (xmin, xmax, ymin, ymax)
#> coord. ref. : ETRS89-extended / LAEA Europe (EPSG:3035)
#> names : start_with_s n mean
#> type : <lgl> <int> <num>
#> values : FALSE 6 28
#> TRUE 3 39.6667
autoplot(no_diss, aes(fill = start_with_s)) +
ggplot2::labs(title = "Not Dissolved")
# Keep geometries separate.
no_diss <- gr_v |>
summarise(n = dplyr::n(), mean = mean(as.double(cpro)), .dissolve = FALSE)
# Same statistic.
no_diss
#> class : SpatVector
#> geometry : polygons
#> dimensions : 2, 3 (geometries, attributes)
#> extent : 2892687, 3341372, 2017622, 2361600 (xmin, xmax, ymin, ymax)
#> coord. ref. : ETRS89-extended / LAEA Europe (EPSG:3035)
#> names : start_with_s n mean
#> type : <lgl> <int> <num>
#> values : FALSE 6 28
#> TRUE 3 39.6667
autoplot(no_diss, aes(fill = start_with_s)) +
ggplot2::labs(title = "Not Dissolved")
