A tibble including the color map of
33 gradient palettes. Each palette
also includes a definition of color limits in terms of elevation (meters)
that can be used with ggplot2::scale_fill_gradientn().
Format
A tibble of 1102 rows and 6 columns with the following fields:
- pal
Name of the palette.
- limit
Recommended elevation limit (in meters) for each color.
- r
Value of the red channel (RGB color mode).
- g
Value of the green channel (RGB color mode).
- b
Value of the blue channel (RGB color mode).
- hex
Hex code of the color.
Source
cpt-city: https://phillips.shef.ac.uk/pub/cpt-city/.
See also
Other datasets:
cross_blended_hypsometric_tints_db,
grass_db,
princess_db,
volcano2
Examples
# \donttest{
data("hypsometric_tints_db")
hypsometric_tints_db
#> # A tibble: 1,102 × 6
#> pal limit r g b hex
#> <chr> <dbl> <dbl> <dbl> <dbl> <chr>
#> 1 arctic -5000 44 53 99 #2C3563
#> 2 arctic -4900 46 54 100 #2E3664
#> 3 arctic -4800 48 56 103 #303867
#> 4 arctic -4700 50 59 106 #323B6A
#> 5 arctic -4600 52 60 107 #343C6B
#> 6 arctic -4500 54 61 109 #363D6D
#> 7 arctic -4400 56 63 111 #383F6F
#> 8 arctic -4300 57 65 113 #394171
#> 9 arctic -4200 60 68 116 #3C4474
#> 10 arctic -4100 62 70 118 #3E4676
#> # ℹ 1,092 more rows
# Select a palette
wikicols <- hypsometric_tints_db |>
filter(pal == "wiki-2.0")
f <- system.file("extdata/asia.tif", package = "tidyterra")
r <- terra::rast(f)
library(ggplot2)
p <- ggplot() +
geom_spatraster(data = r) +
labs(fill = "elevation")
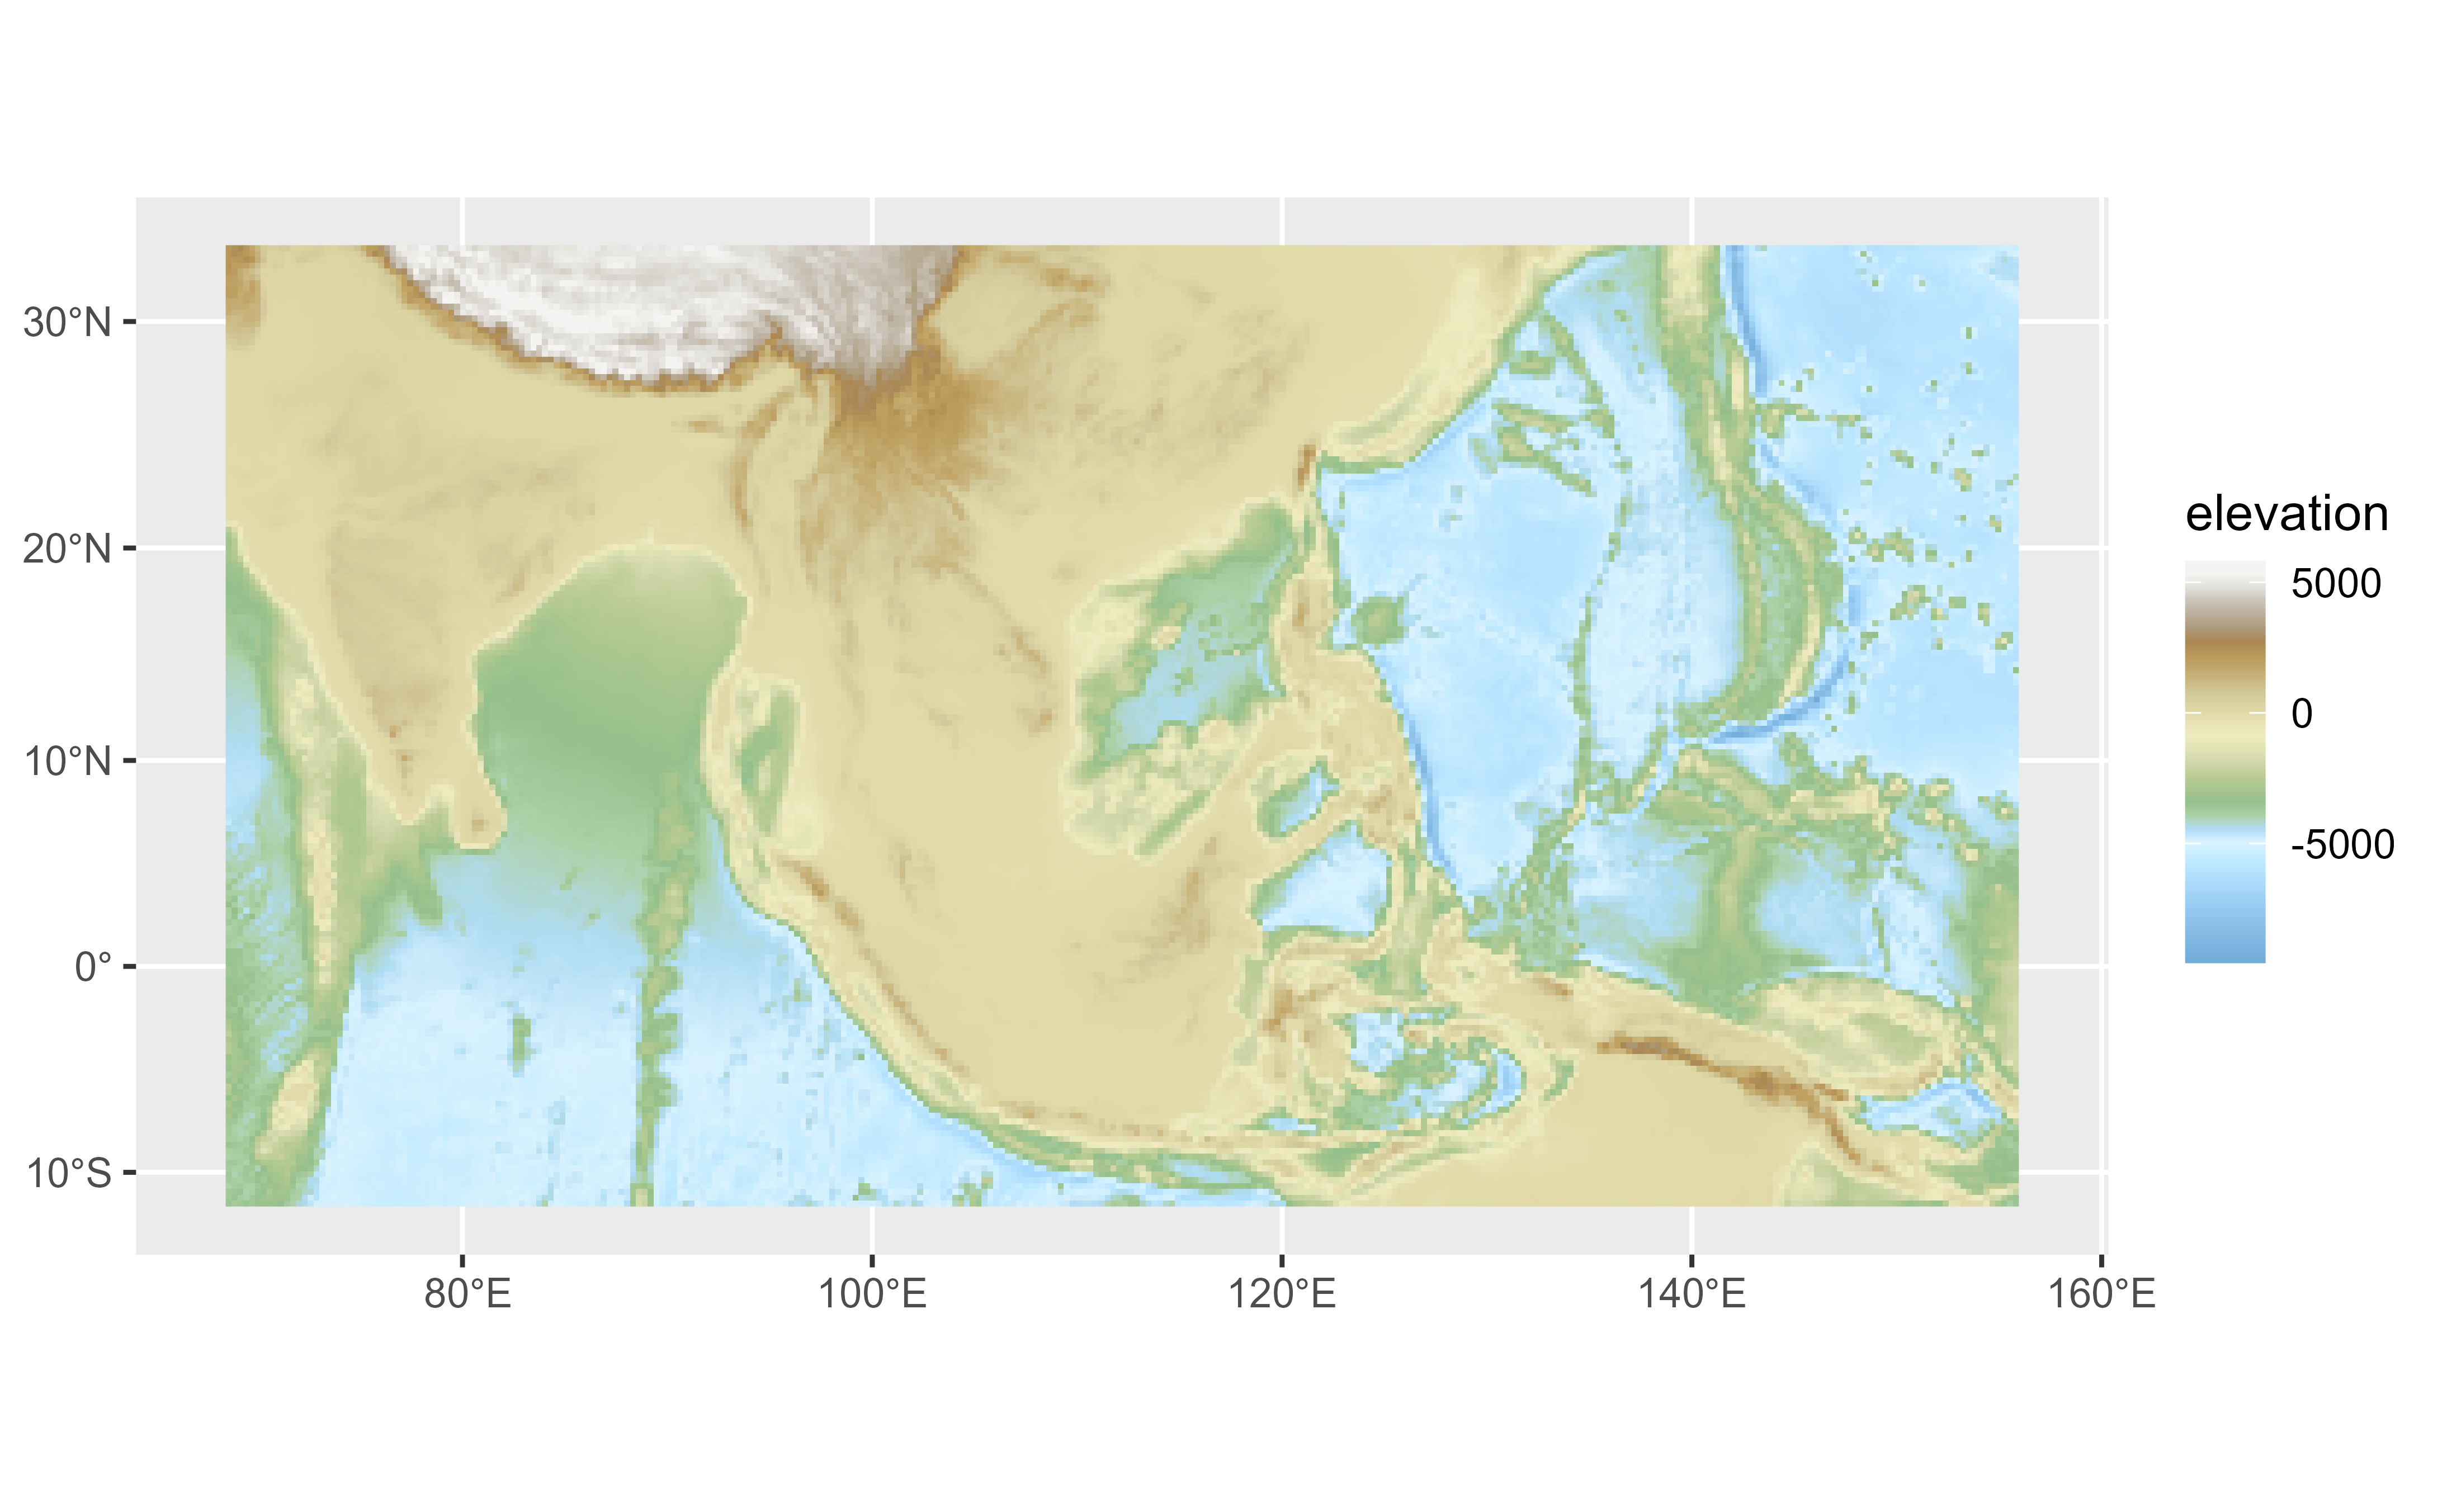
p +
scale_fill_gradientn(colors = wikicols$hex)
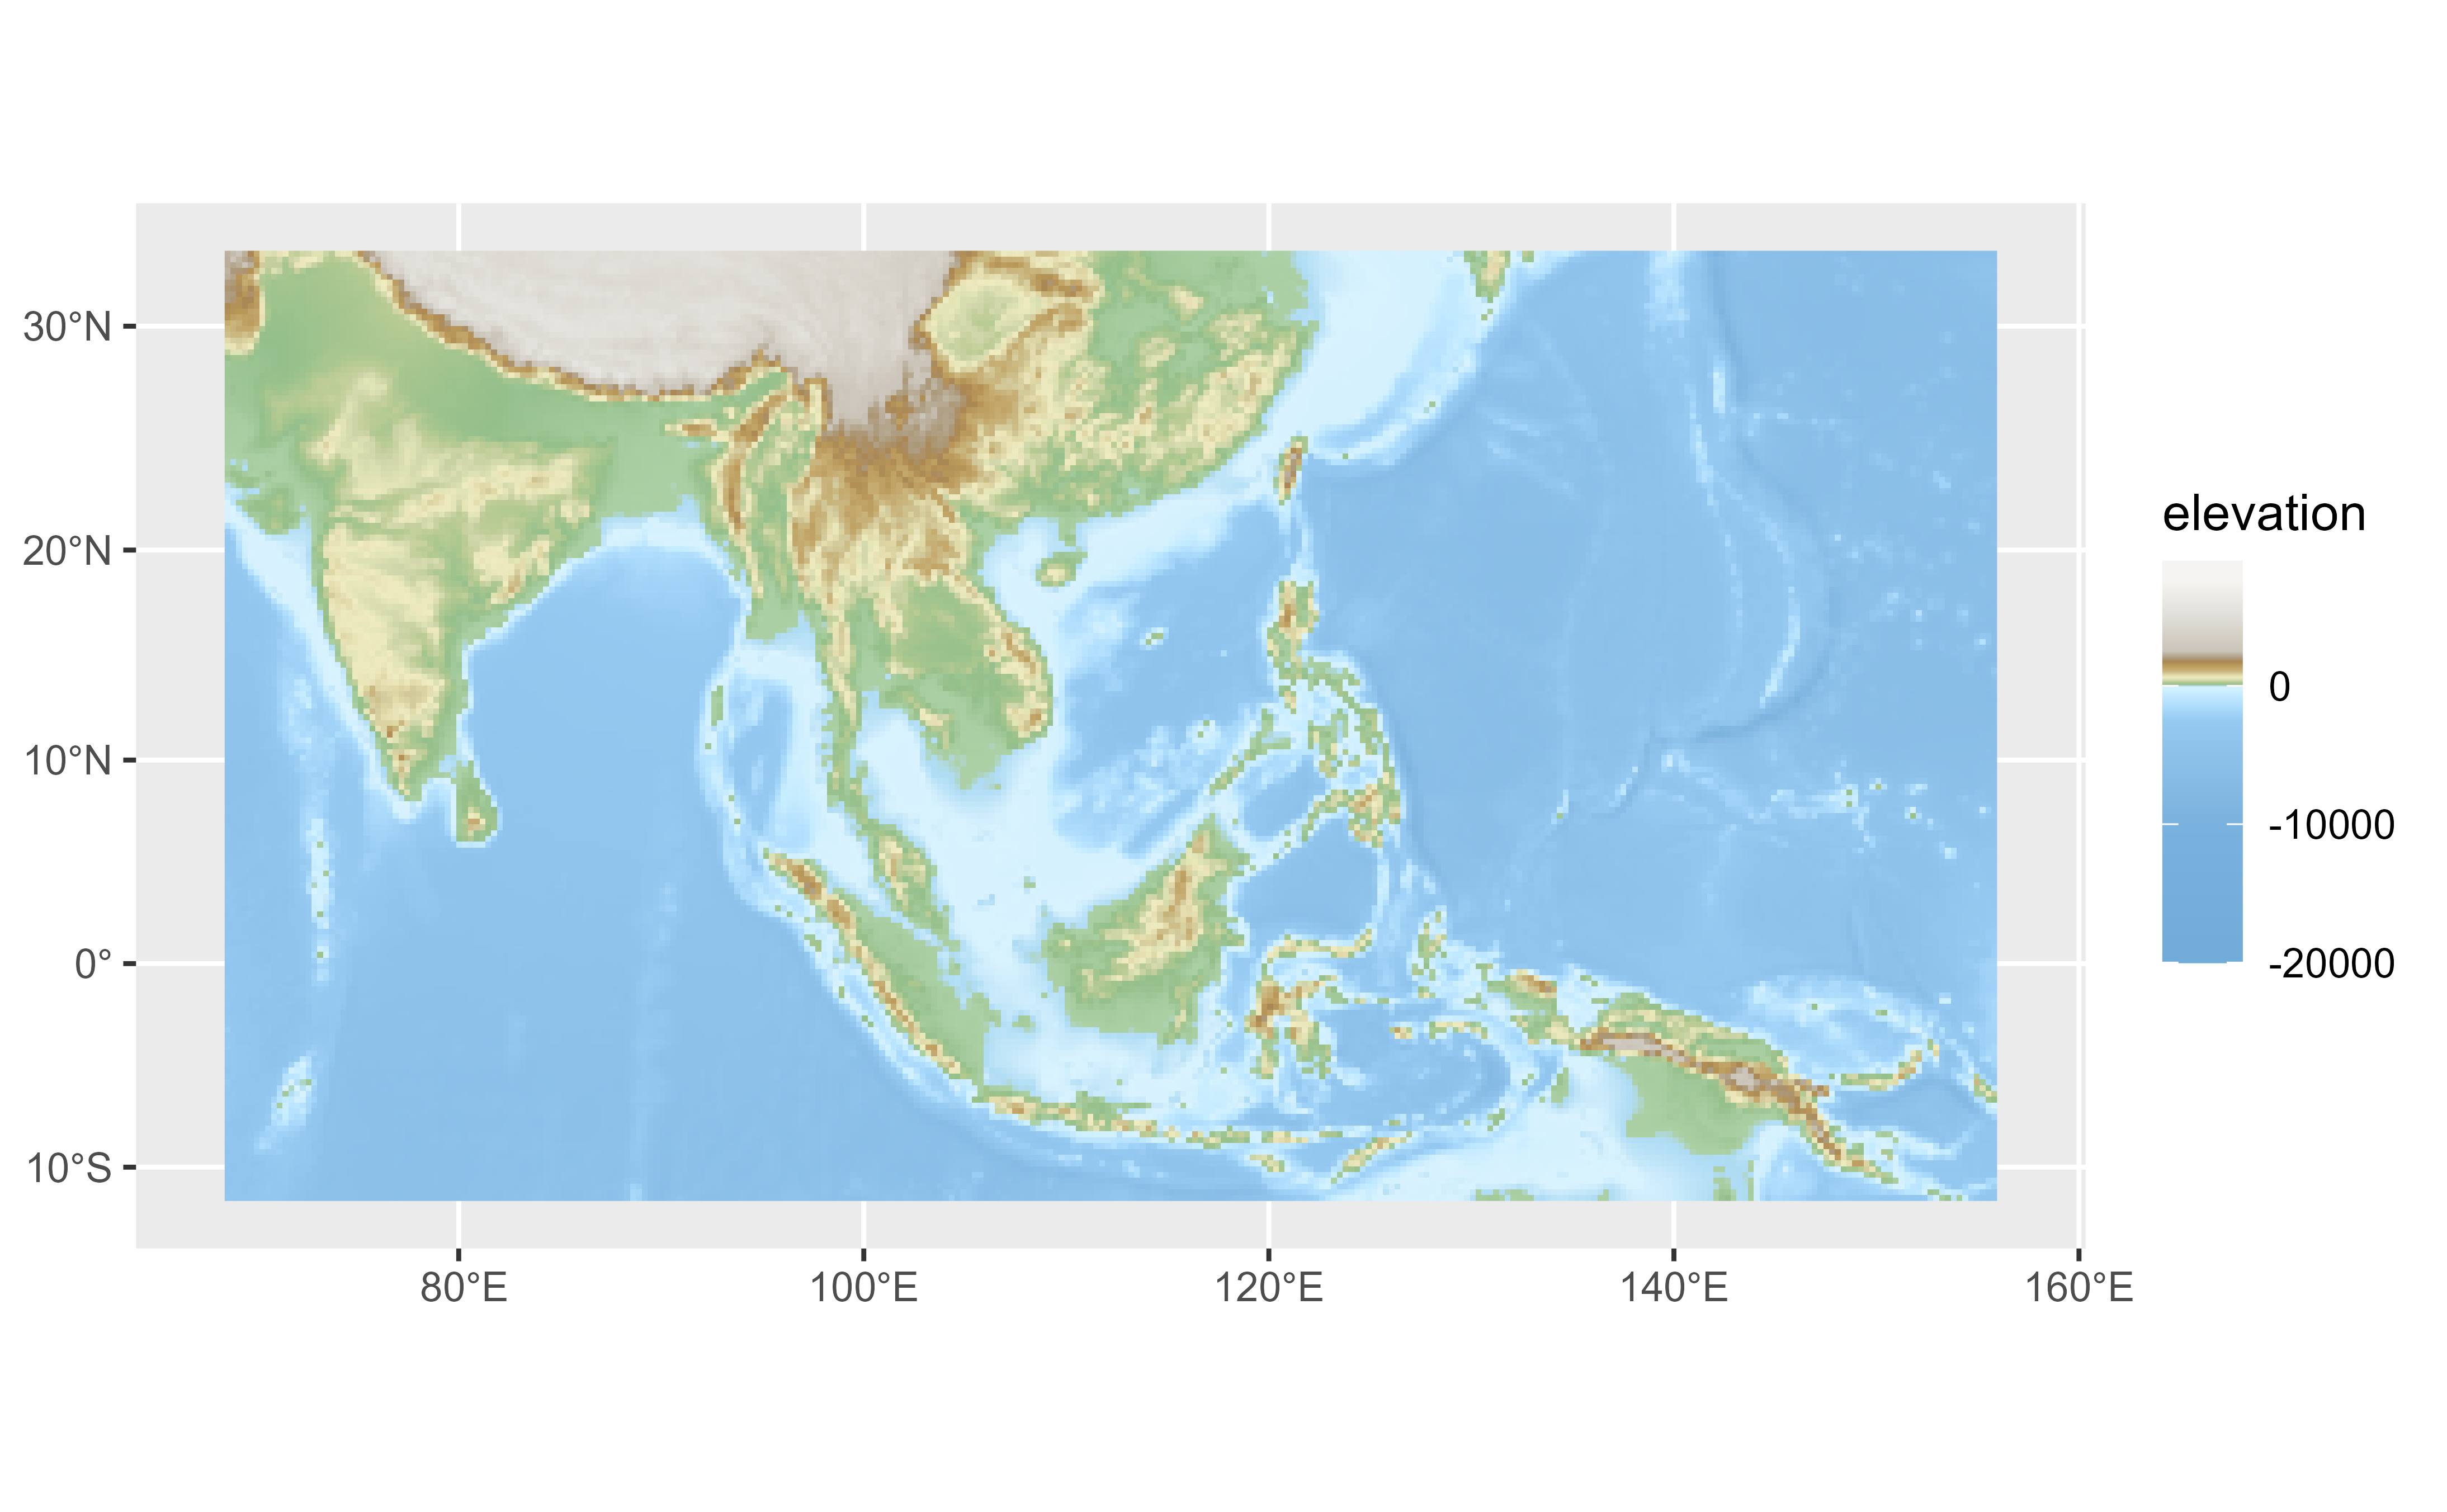
 # Use with limits
p +
scale_fill_gradientn(
colors = wikicols$hex,
values = scales::rescale(wikicols$limit),
limit = range(wikicols$limit)
)
# Use with limits
p +
scale_fill_gradientn(
colors = wikicols$hex,
values = scales::rescale(wikicols$limit),
limit = range(wikicols$limit)
)
 # }
# }