A tibble including the color map of 15 gradient palettes.
Format
A tibble of 75 rows and 5 columns with the following fields:
- pal
Name of the palette.
- r
Value of the red channel (RGB color mode).
- g
Value of the green channel (RGB color mode).
- b
Value of the blue channel (RGB color mode).
- hex
Hex code of the color.
See also
Other datasets:
cross_blended_hypsometric_tints_db,
grass_db,
hypsometric_tints_db,
volcano2
Examples
# \donttest{
data("princess_db")
princess_db
#> # A tibble: 75 × 5
#> pal r g b hex
#> <chr> <int> <int> <int> <chr>
#> 1 snow 227 75 98 #e34b62
#> 2 snow 138 192 229 #8ac0e5
#> 3 snow 10 100 165 #0a64a5
#> 4 snow 255 235 148 #ffeb94
#> 5 snow 255 202 53 #ffca35
#> 6 ella 215 234 246 #d7eaf6
#> 7 ella 177 222 245 #b1def5
#> 8 ella 140 197 232 #8cc5e8
#> 9 ella 59 139 189 #3b8bbd
#> 10 ella 40 98 135 #286287
#> # ℹ 65 more rows
# Select a palette
maori <- princess_db |>
filter(pal == "maori")
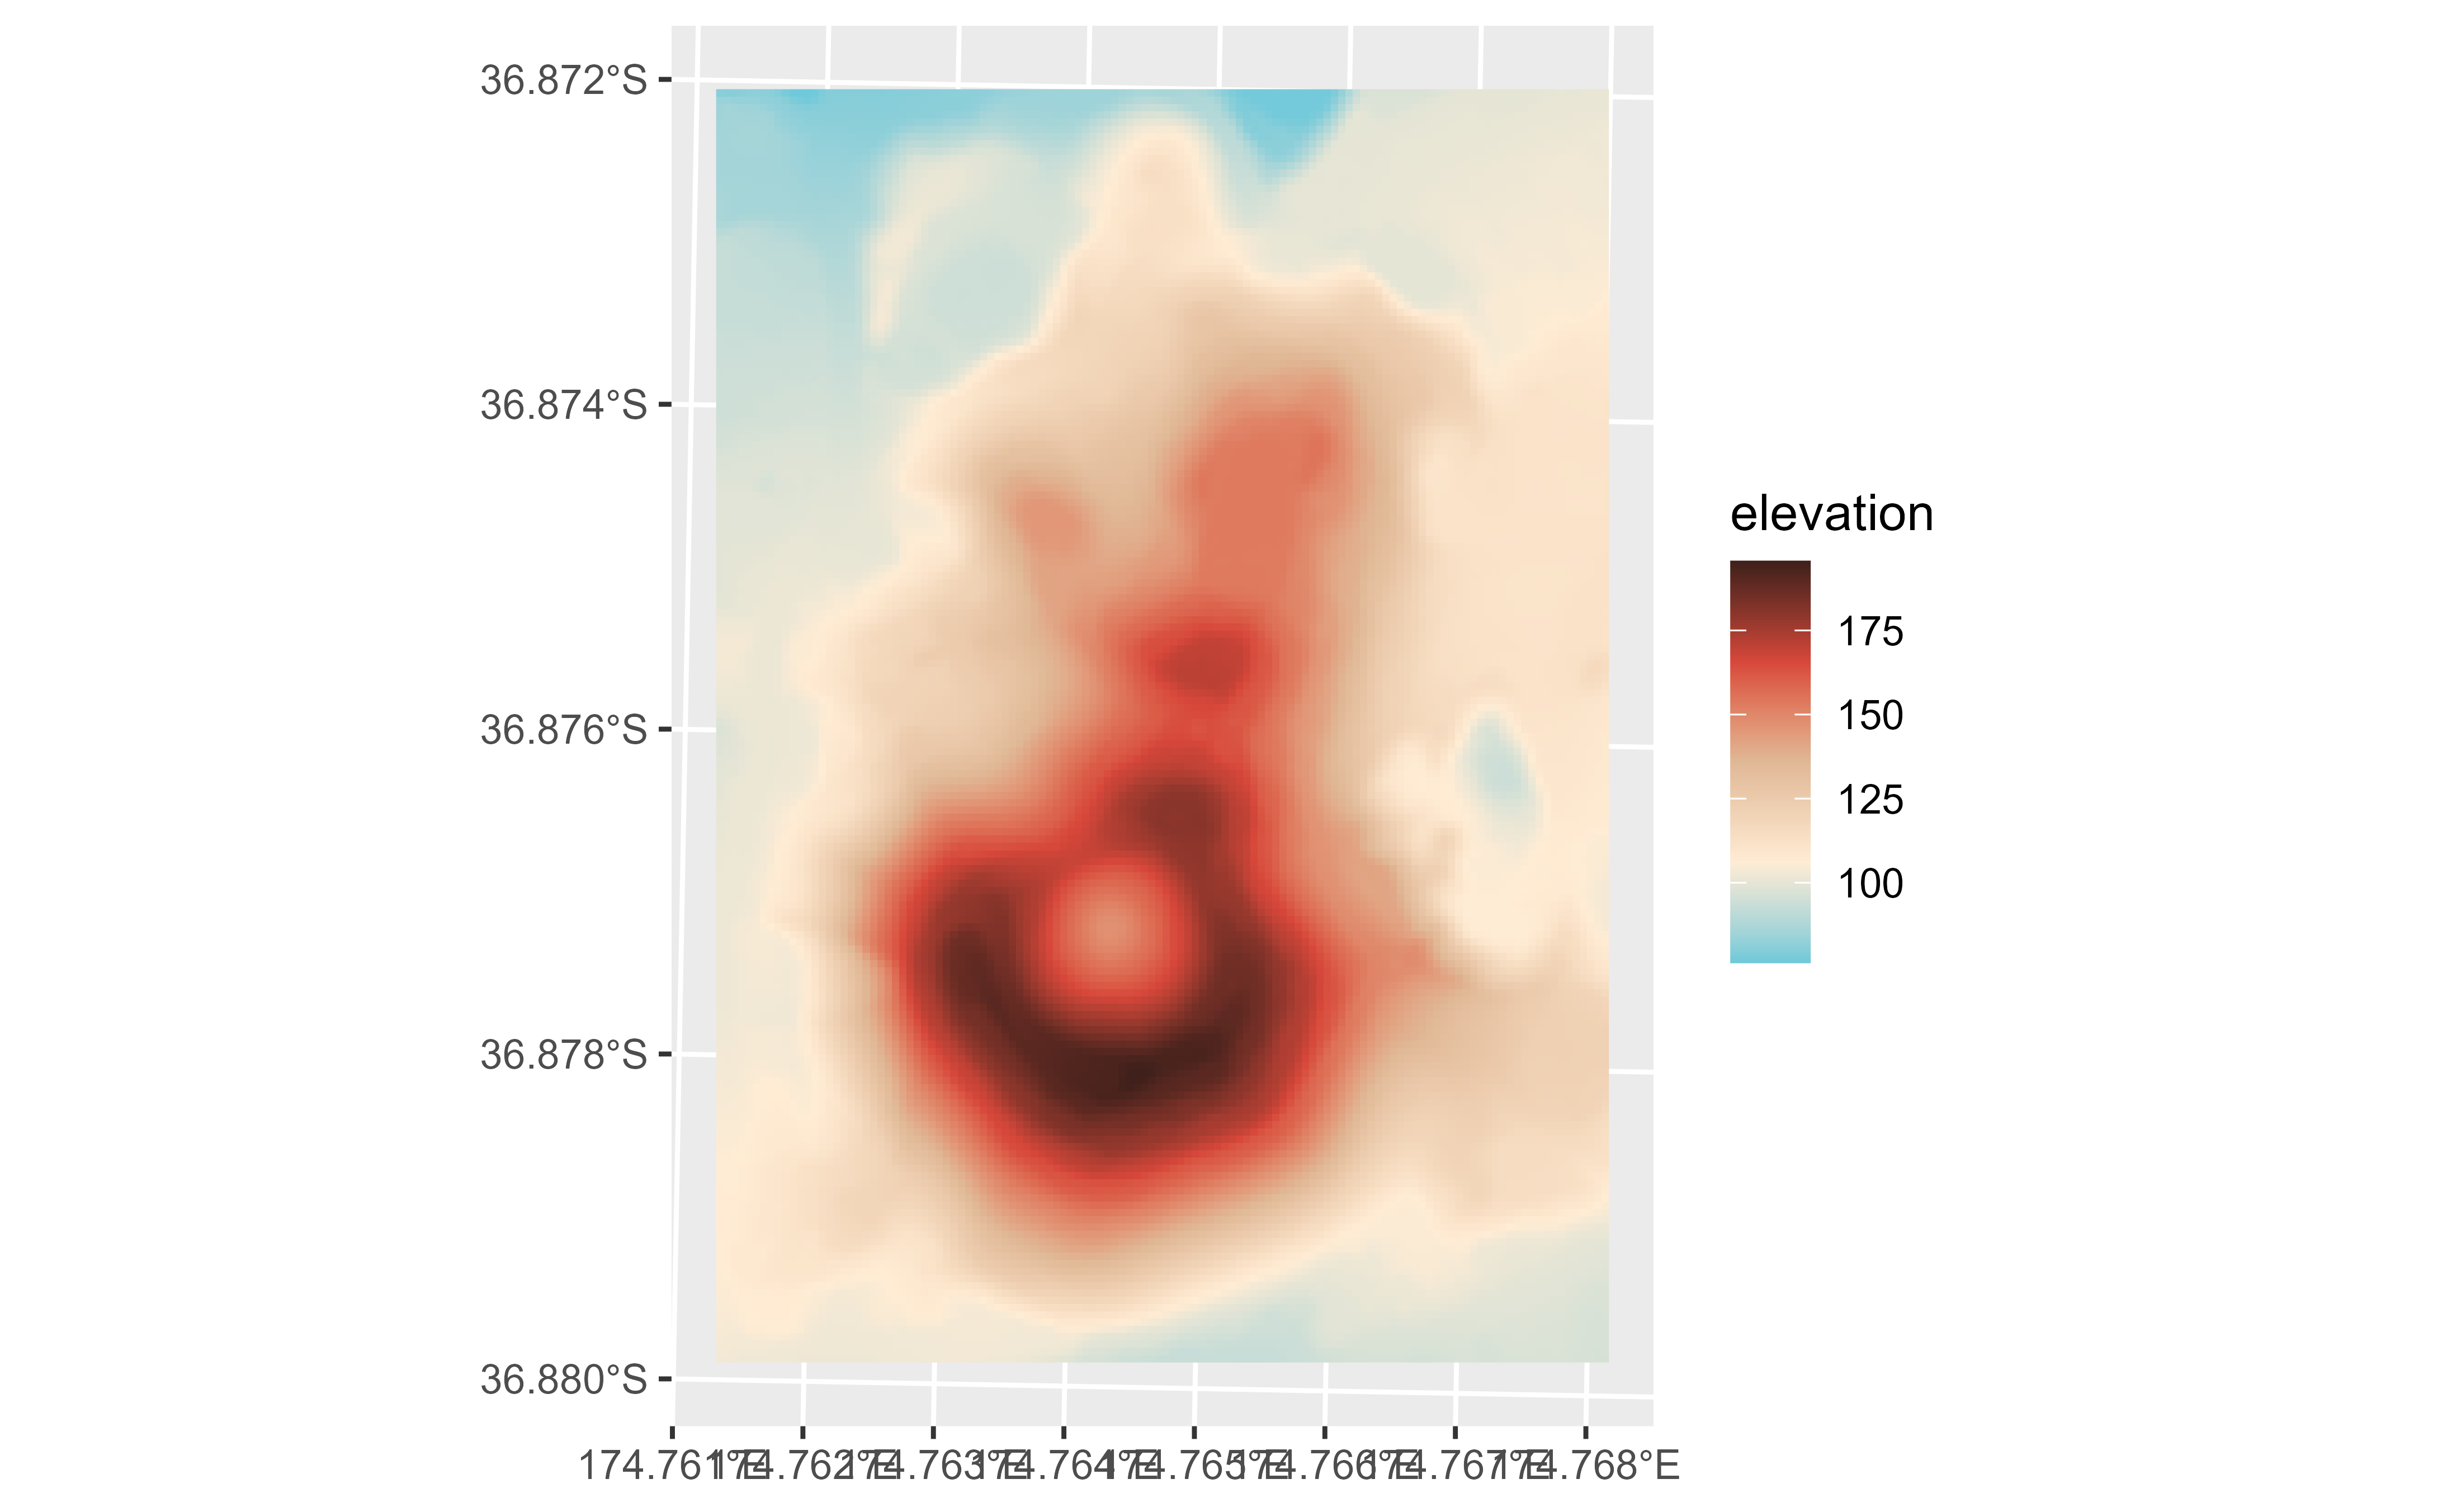
f <- system.file("extdata/volcano2.tif", package = "tidyterra")
r <- terra::rast(f)
library(ggplot2)
p <- ggplot() +
geom_spatraster(data = r) +
labs(fill = "elevation")
p +
scale_fill_gradientn(colors = maori$hex)
 # }
# }