autoplot() uses ggplot2 to draw plots like those
produced by terra::plot()/terra::plotRGB() in a single command.
Usage
# S3 method for class 'SpatRaster'
autoplot(
  object,
  ...,
  rgb = NULL,
  use_coltab = NULL,
  facets = NULL,
  nrow = NULL,
  ncol = 2
)

# S3 method for class 'SpatVector'
autoplot(object, ...)

# S3 method for class 'SpatGraticule'
autoplot(object, ...)

# S3 method for class 'SpatExtent'
autoplot(object, ...)
Arguments
- object
A
SpatRastercreated withterra::rast(), aSpatVectorcreated withterra::vect(), aSpatGraticule(seeterra::graticule()) or aSpatExtent(seeterra::ext()).- ...
Other arguments passed to
geom_spatraster(),geom_spatraster_rgb()orgeom_spatvector().- rgb
Logical. If
TRUE, plot as an RGB image. IfNULL(the default),autoplot.SpatRaster()tries to guess.- use_coltab
Logical. If
TRUE, plot with the corresponding color table fromterra::coltab(). IfNULL(the default),autoplot.SpatRaster()tries to guess. See alsoscale_fill_coltab().- facets
Logical. If
TRUE, display facets. IfNULL(the default),autoplot.SpatRaster()tries to guess.- nrow, ncol
Number of rows and columns in the facet.
Value
A ggplot2 plot.
Methods
Implementation of the generic ggplot2::autoplot() methods for Spat*
objects.
SpatRaster
Uses geom_spatraster() or geom_spatraster_rgb().
SpatVector, SpatGraticule and SpatExtent
Uses geom_spatvector(). Labels can be placed with geom_spatvector_text()
or geom_spatvector_label().
See also
Other ggplot2 helpers:
fortify.Spat,
geom_spat_contour,
geom_spatraster(),
geom_spatraster_rgb(),
ggspatvector,
stat_spat_coordinates()
Other ggplot2 methods:
fortify.Spat
Examples
# \donttest{
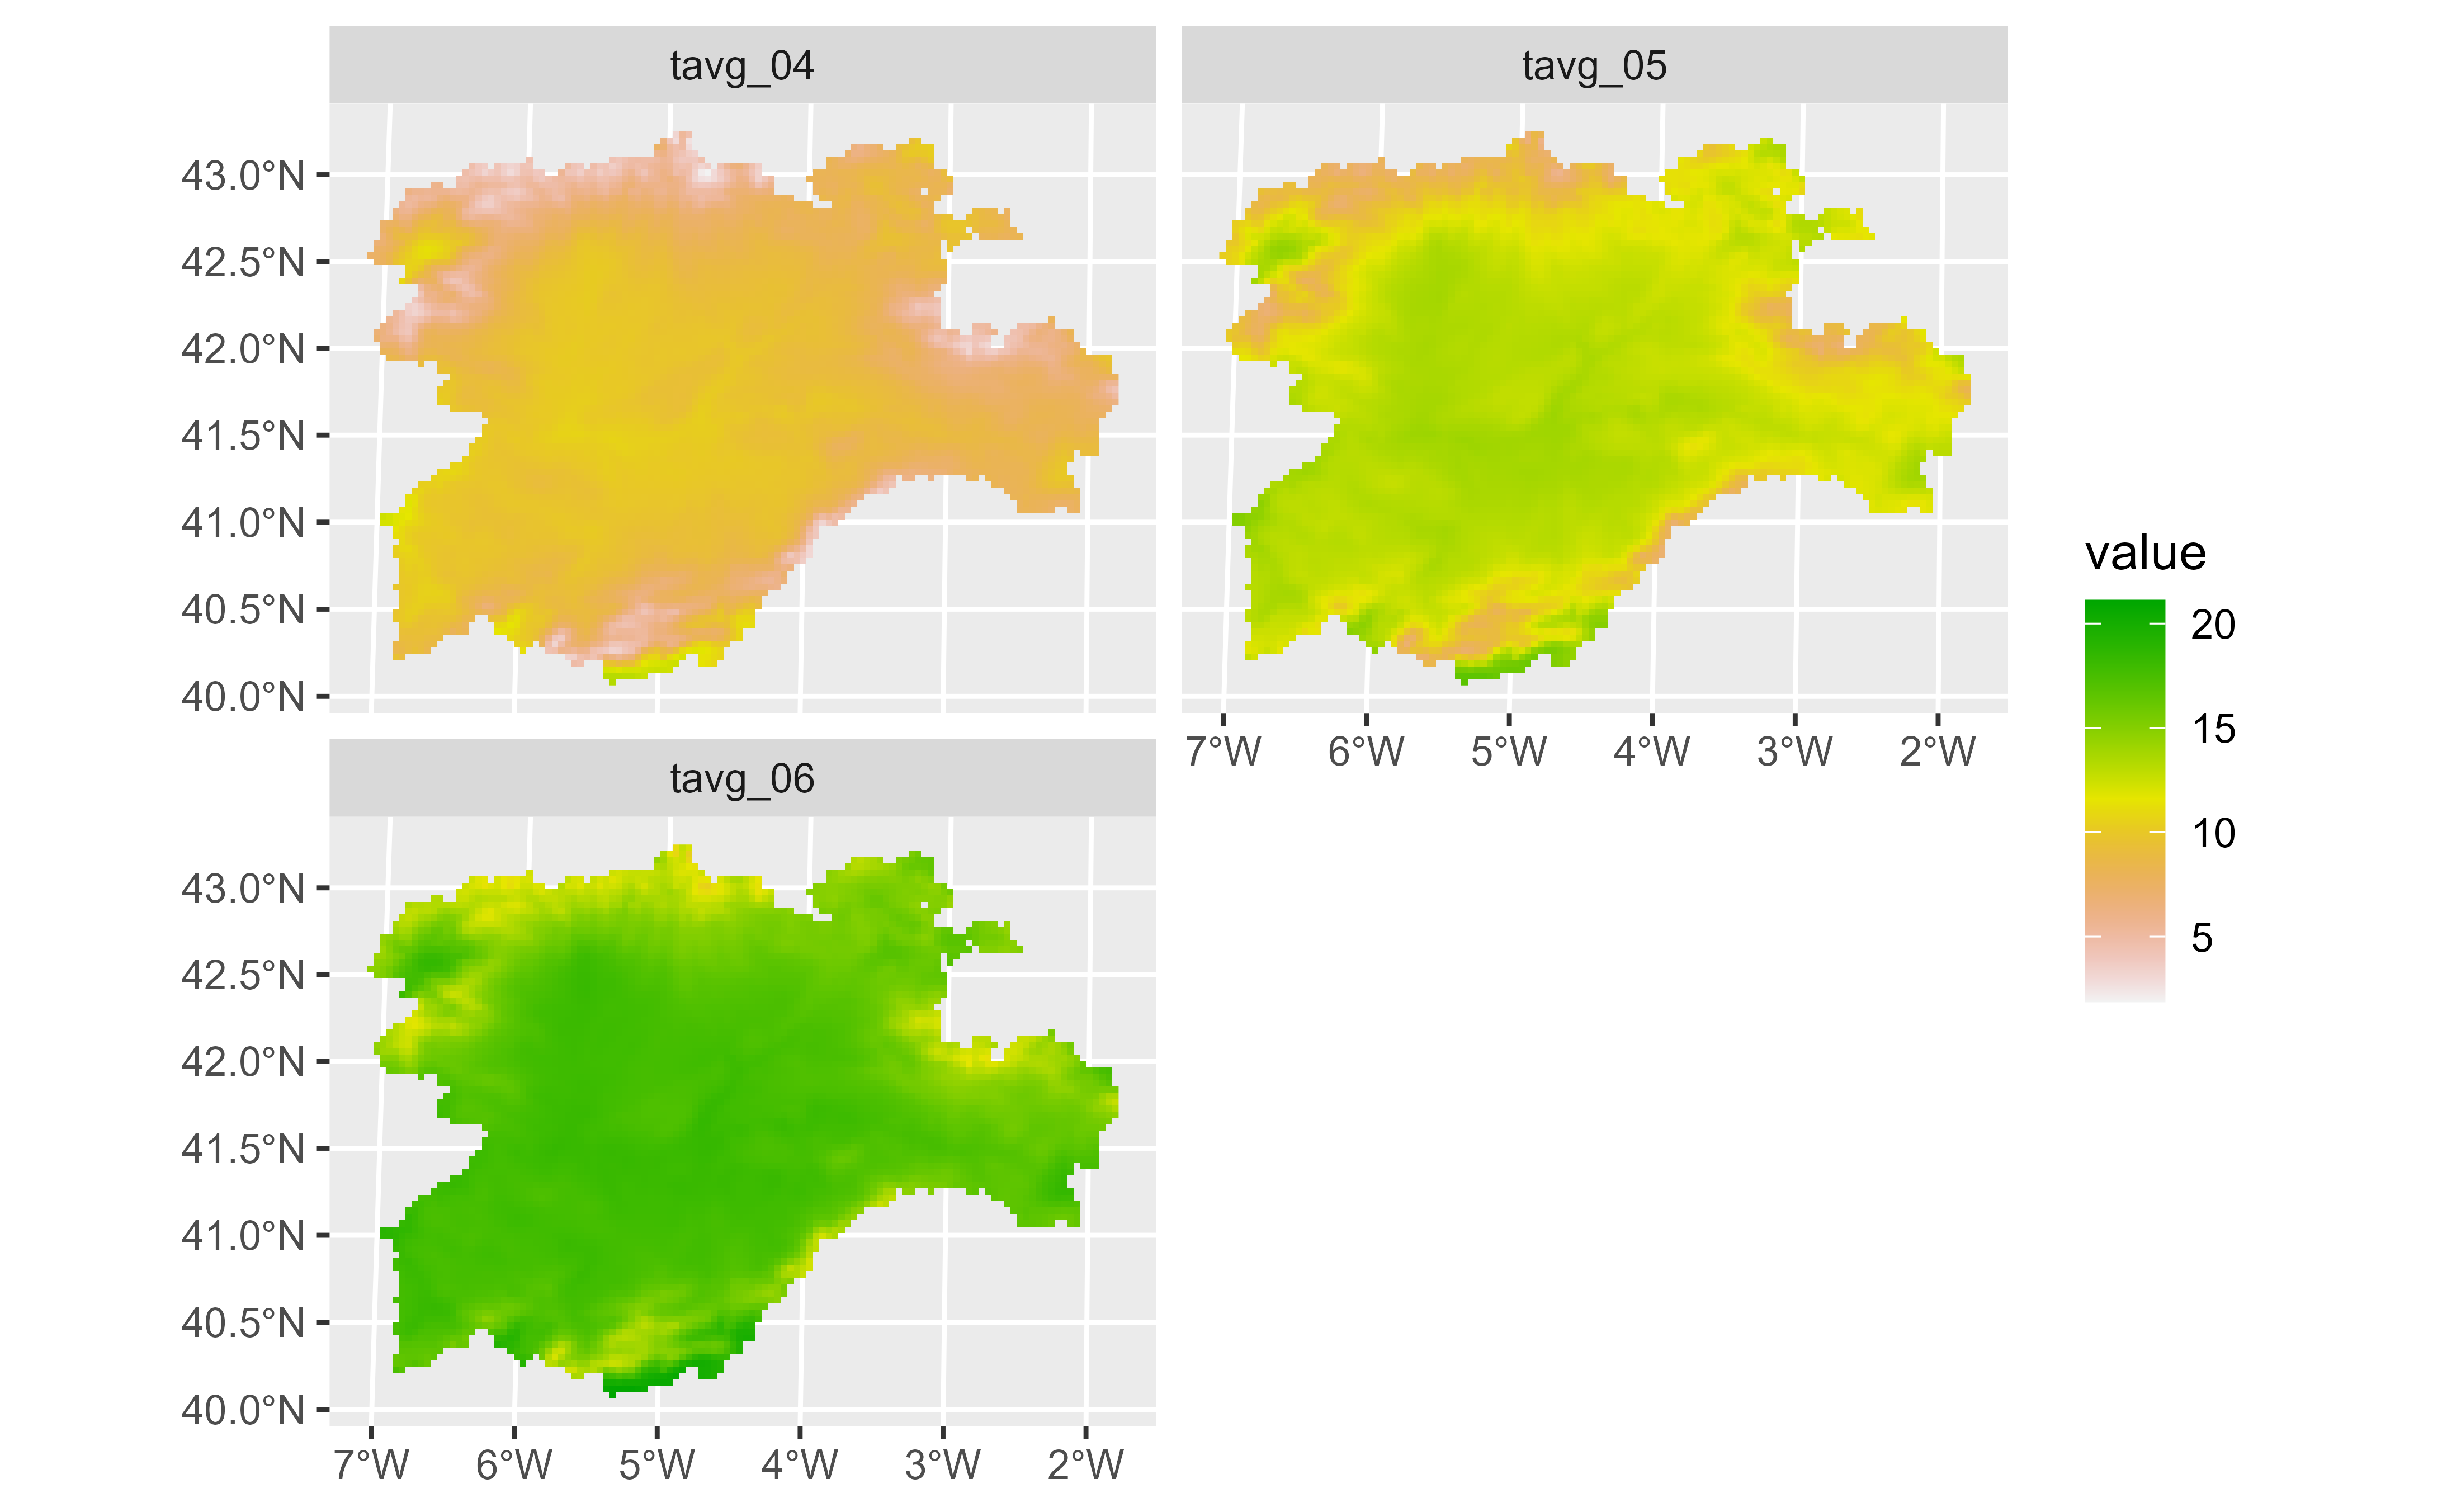
file_path <- system.file("extdata/cyl_temp.tif", package = "tidyterra")
library(terra)
temp <- rast(file_path)
library(ggplot2)
autoplot(temp)
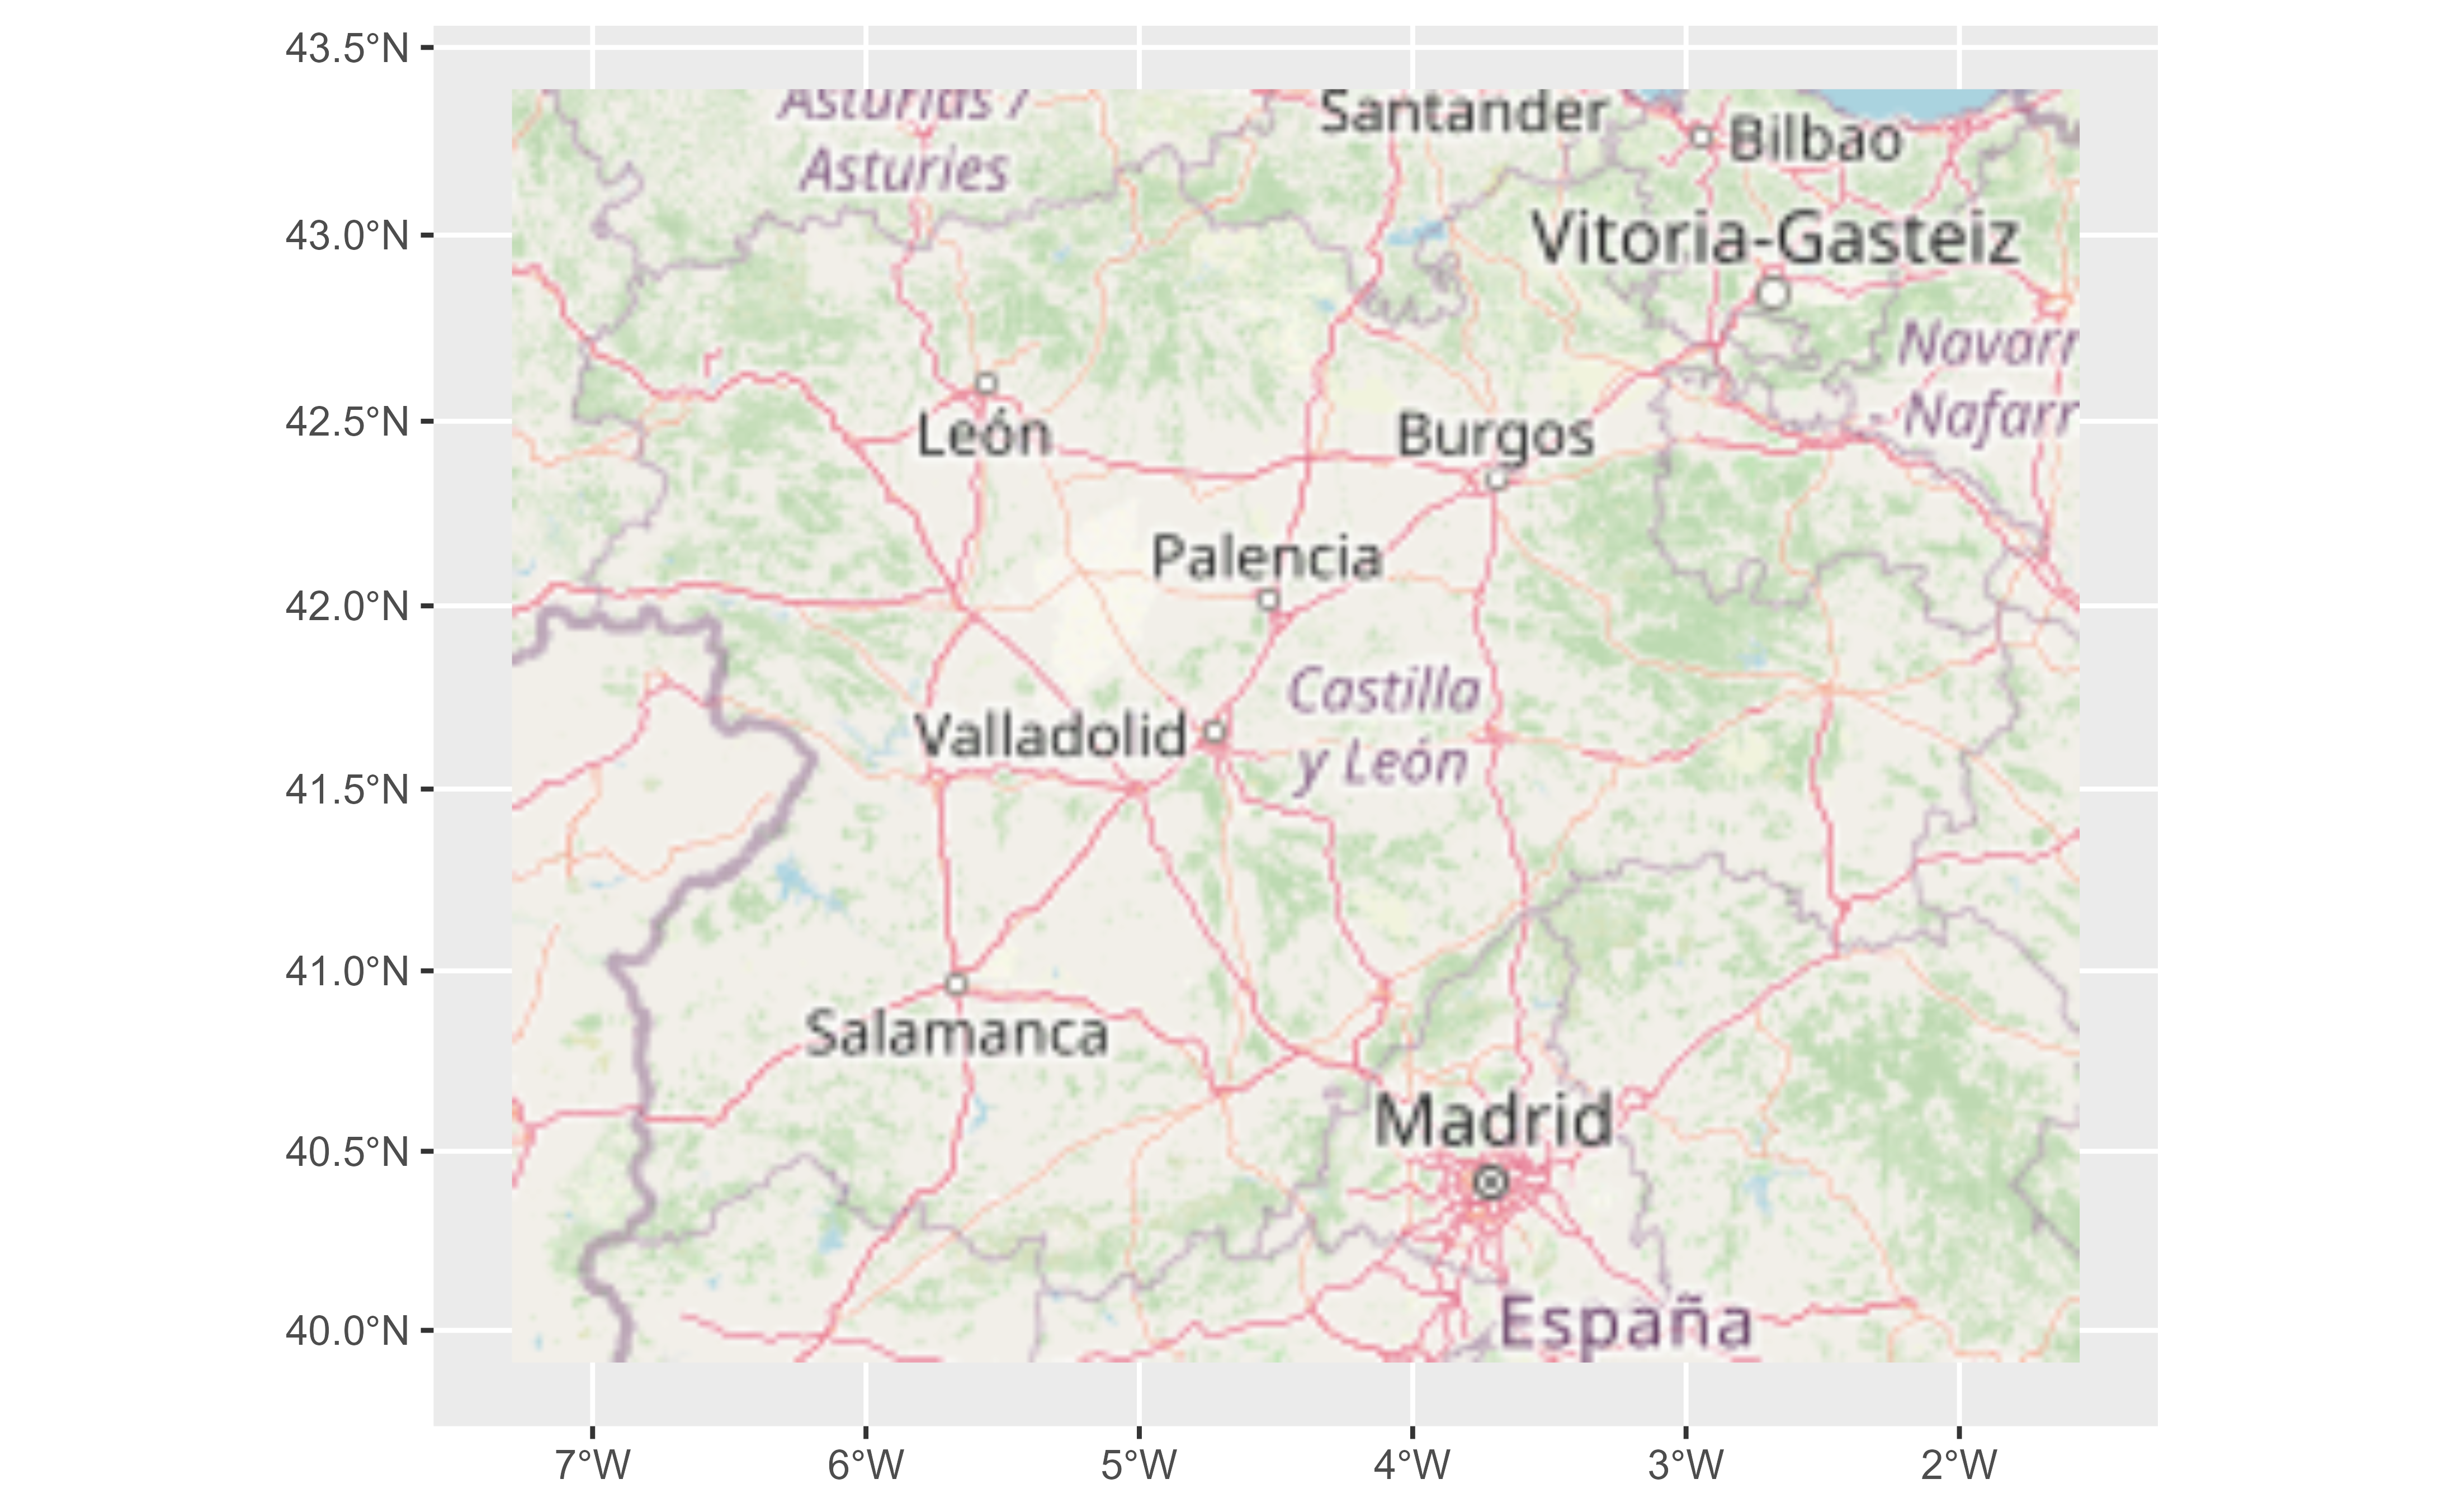
 # With a tile
tile <- system.file("extdata/cyl_tile.tif", package = "tidyterra") |>
rast()
autoplot(tile)
# With a tile
tile <- system.file("extdata/cyl_tile.tif", package = "tidyterra") |>
rast()
autoplot(tile)
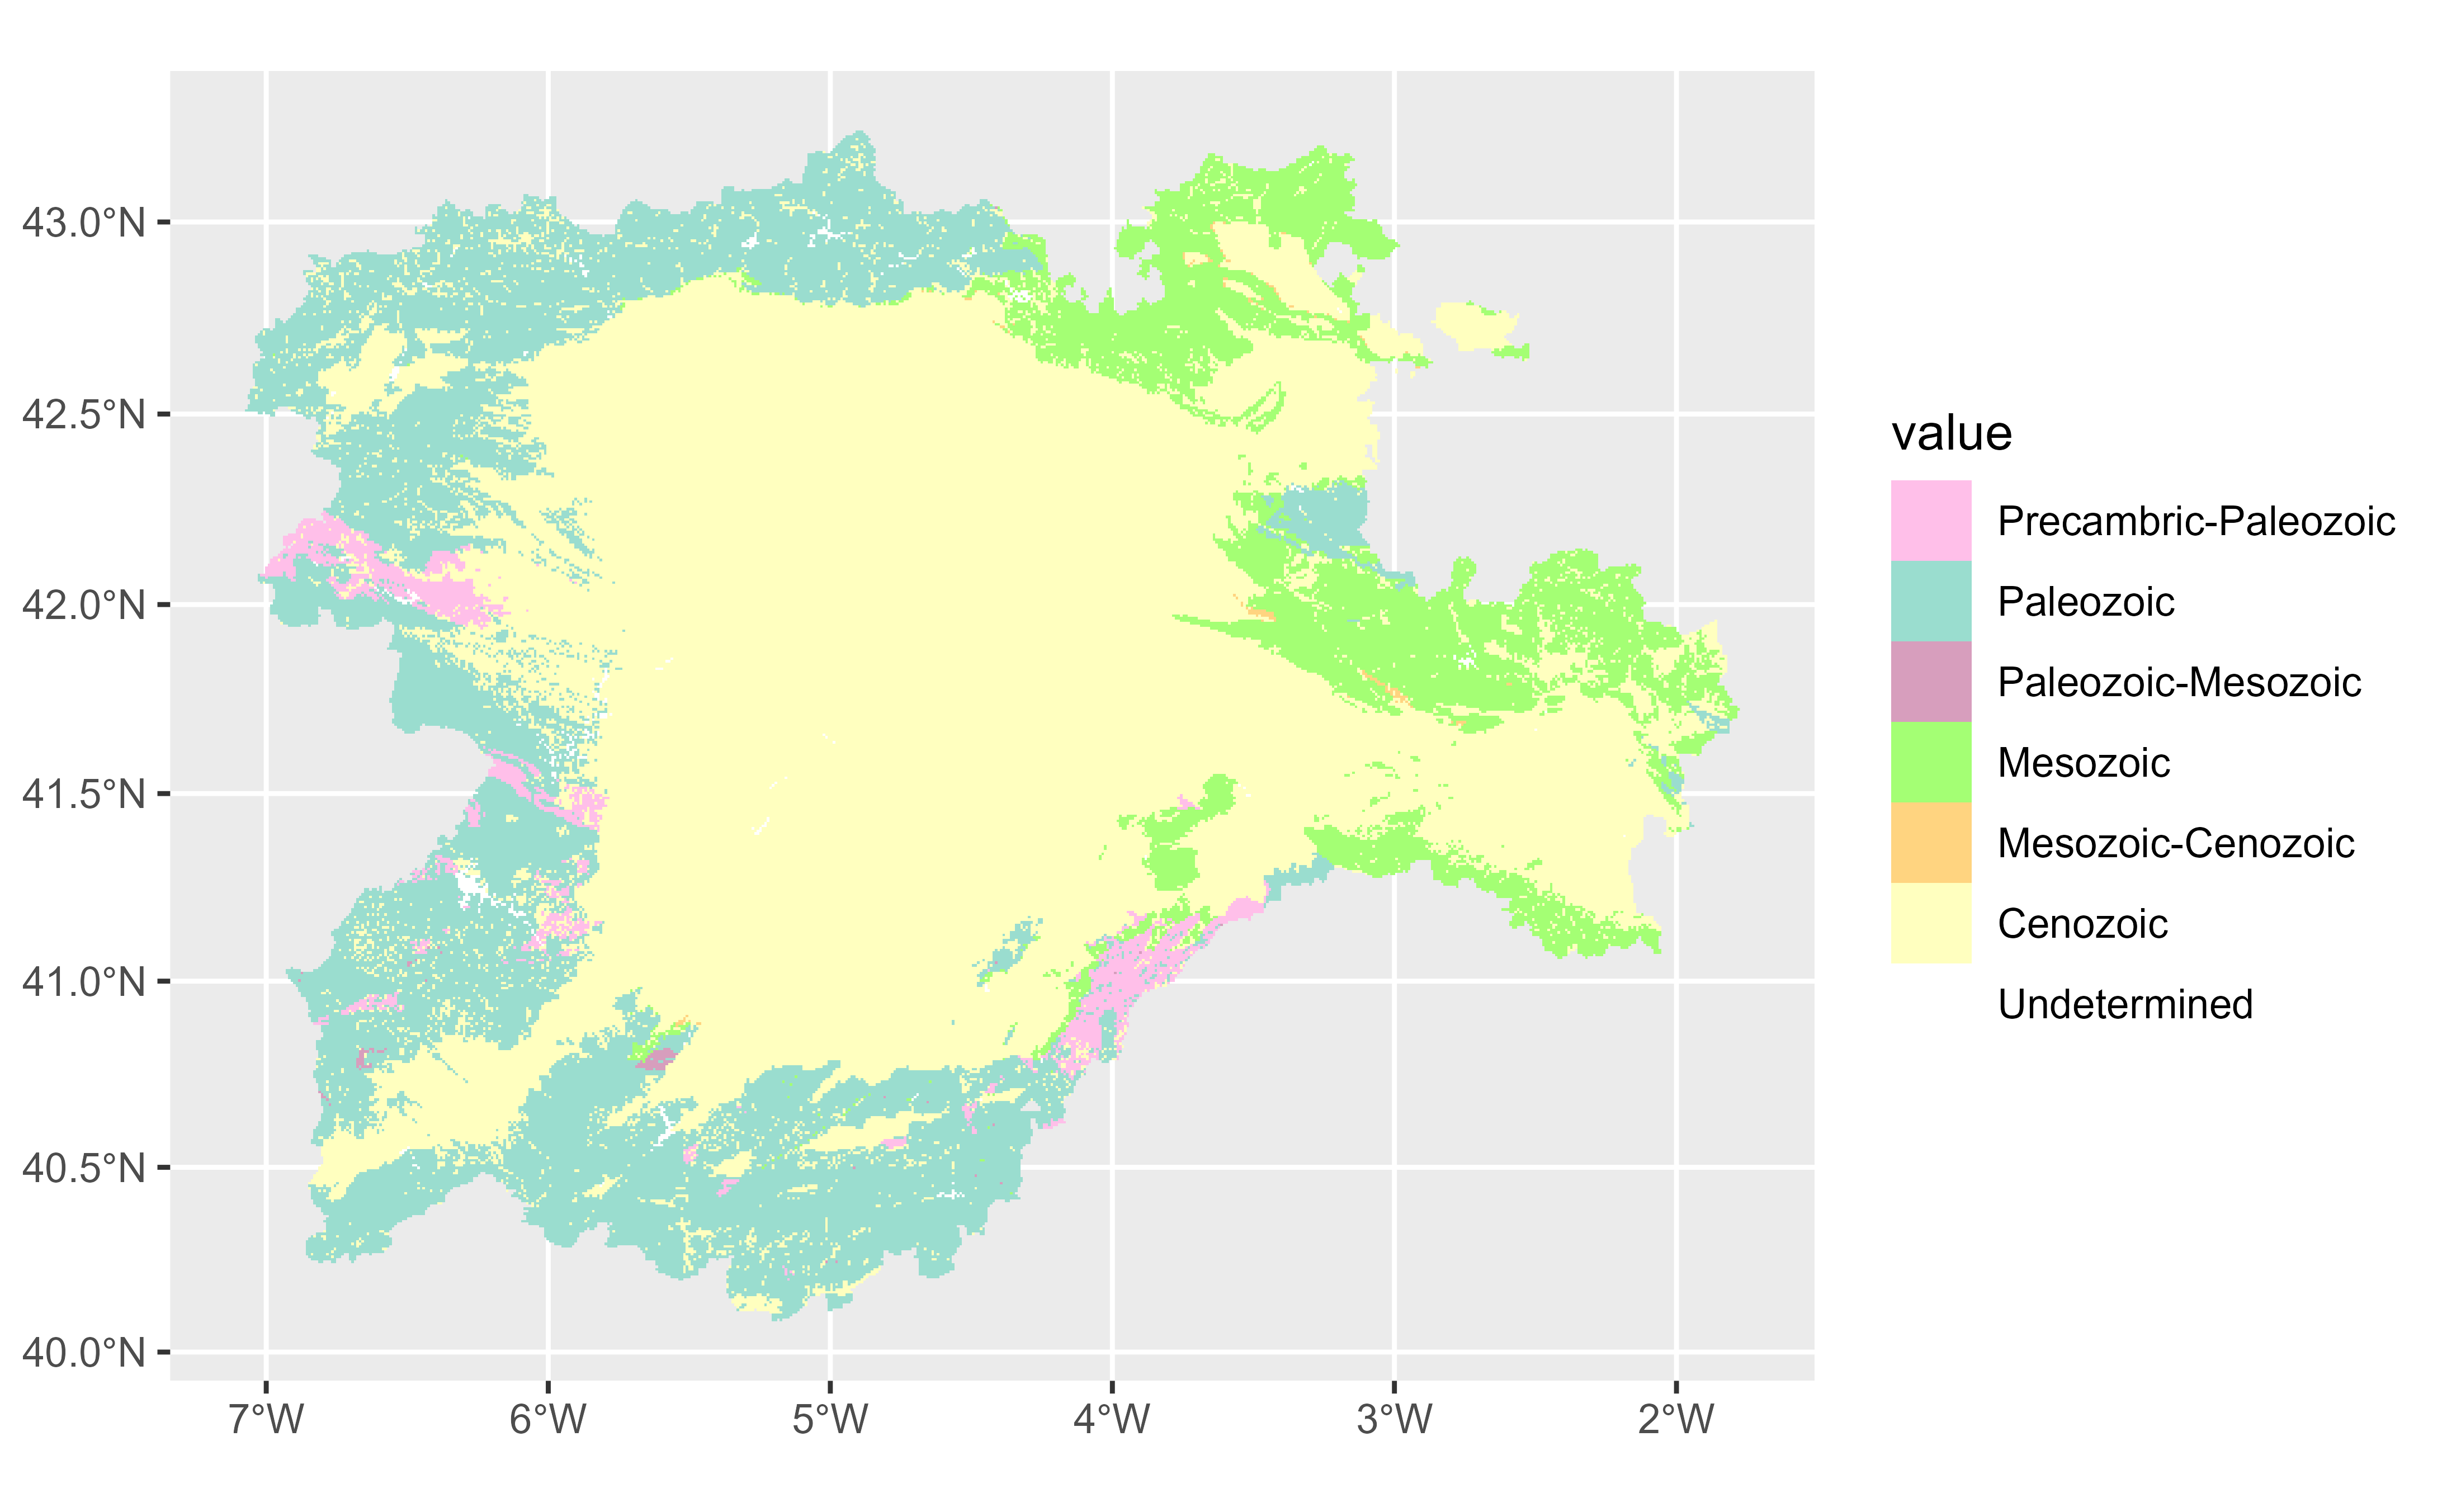
 # With color tables
ctab <- system.file("extdata/cyl_era.tif", package = "tidyterra") |>
rast()
autoplot(ctab)
# With color tables
ctab <- system.file("extdata/cyl_era.tif", package = "tidyterra") |>
rast()
autoplot(ctab)
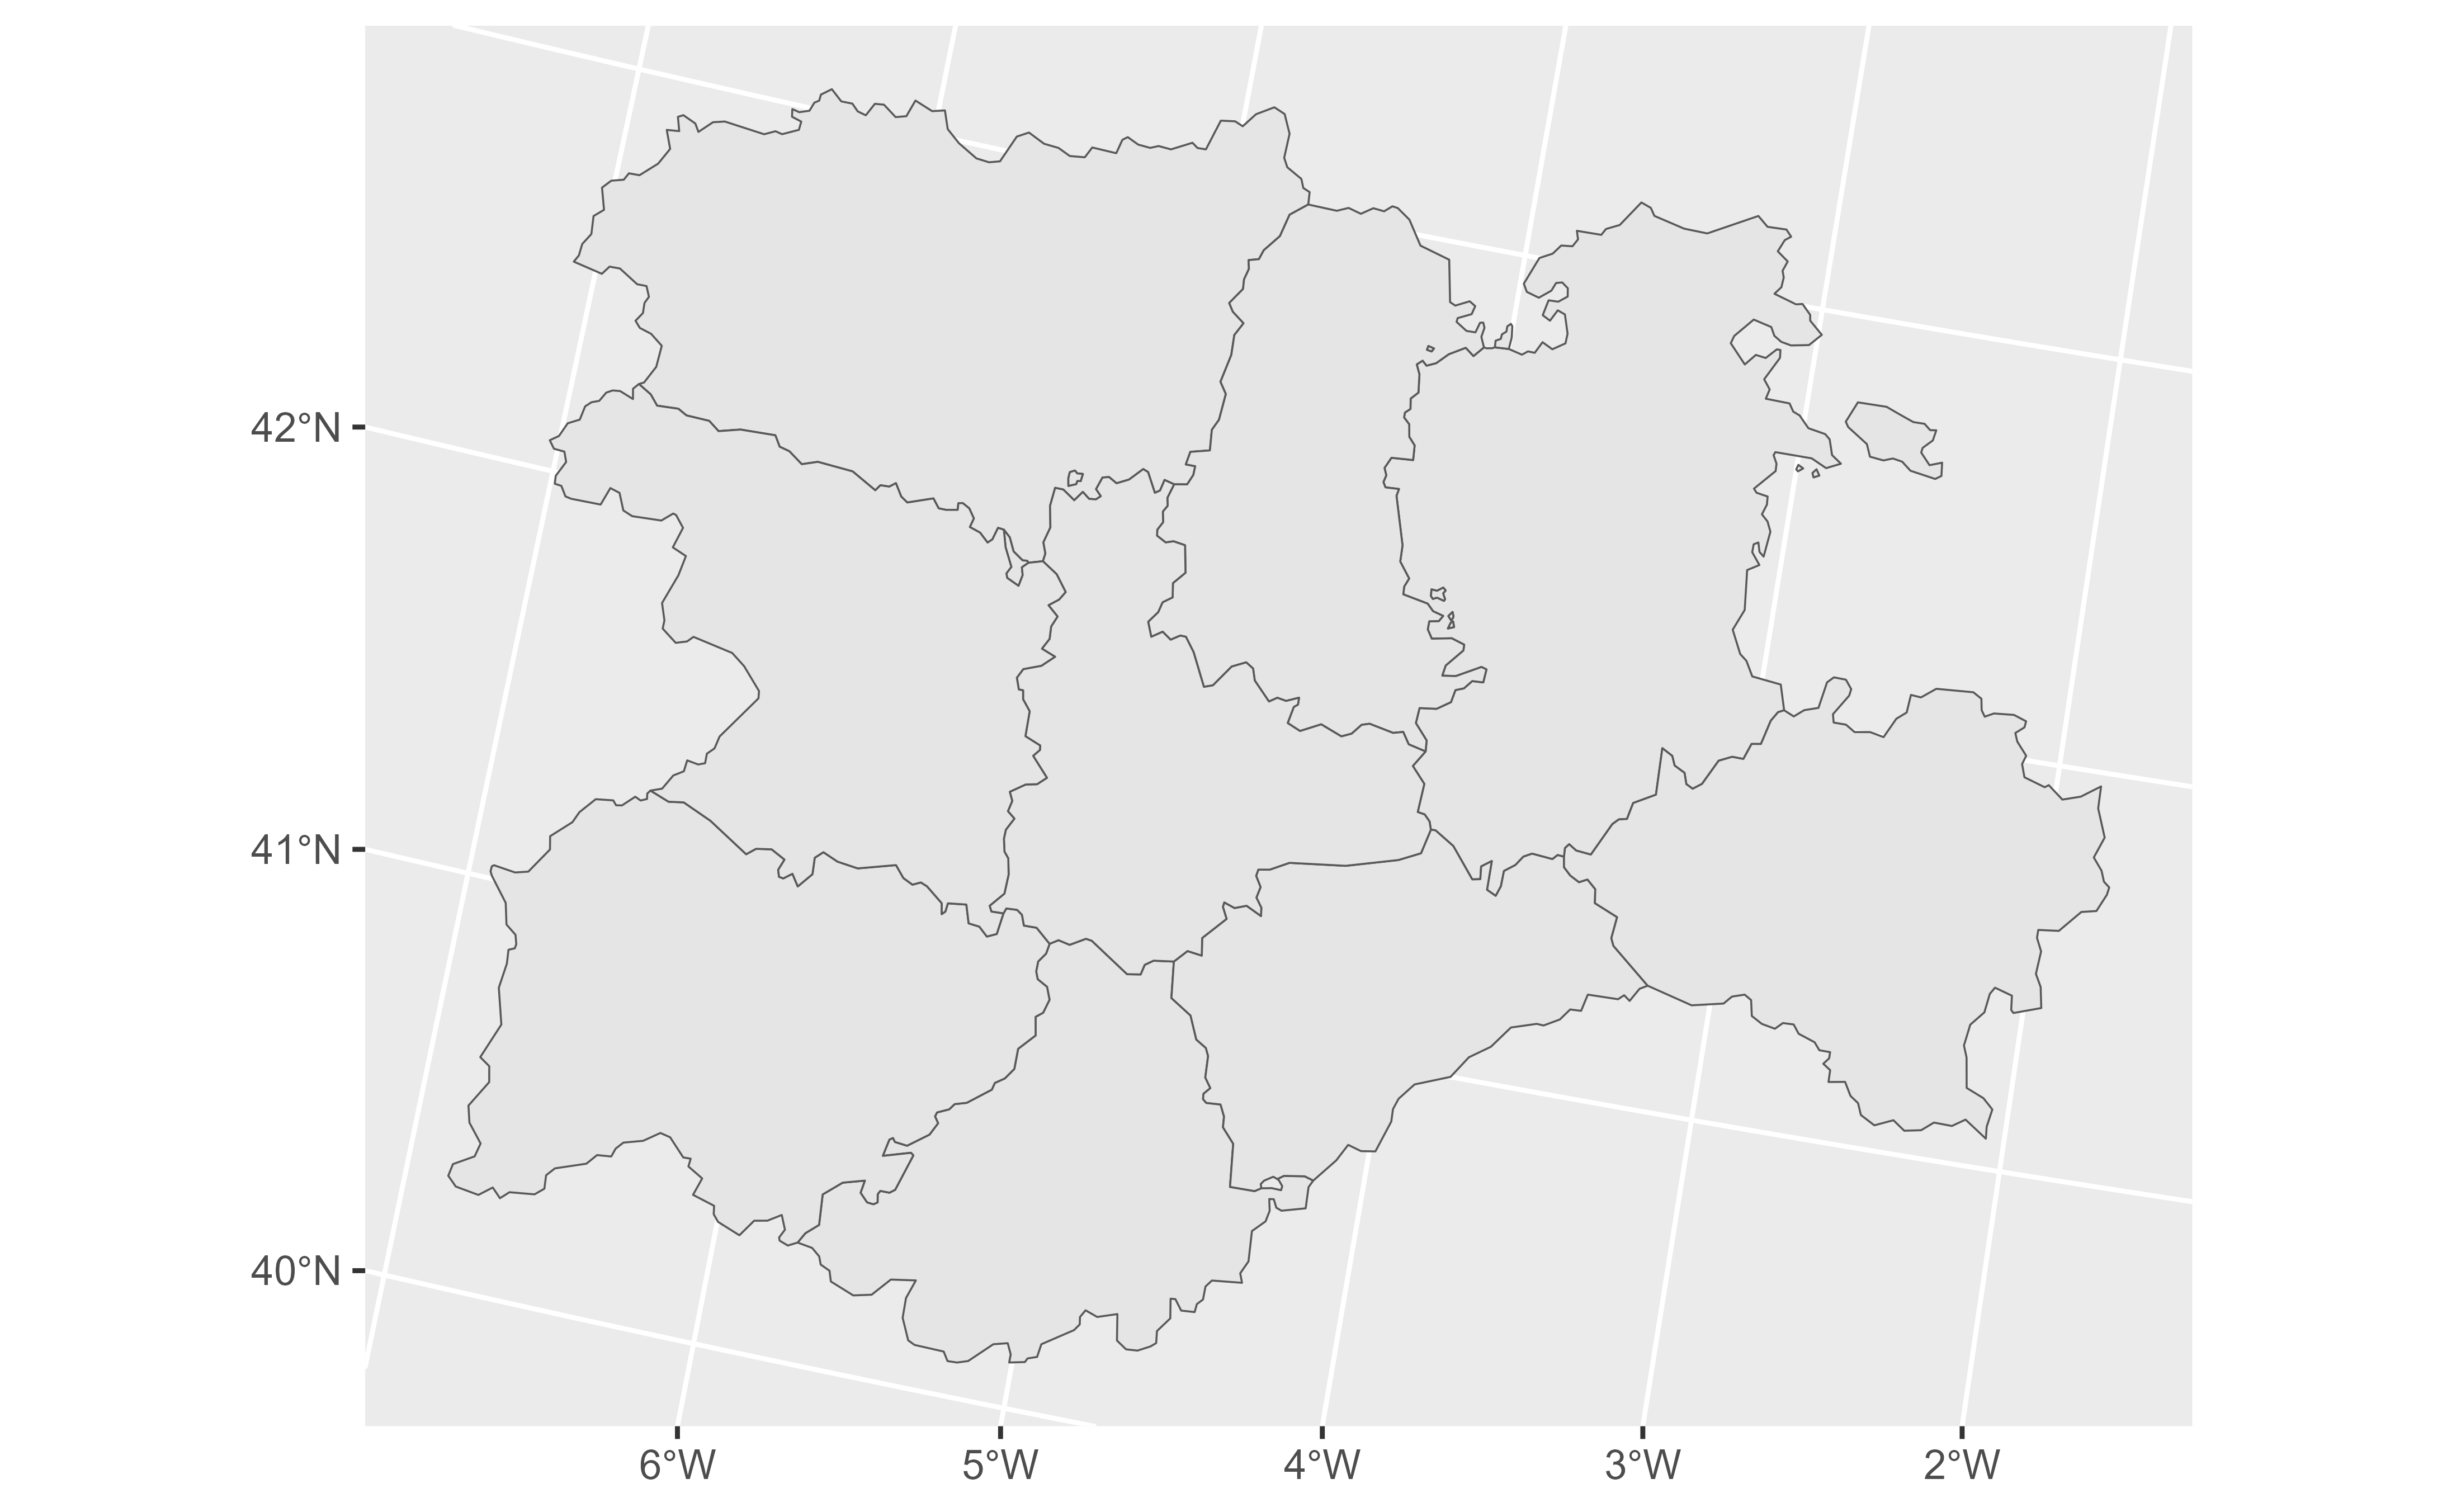
 # With vectors
v <- vect(system.file("extdata/cyl.gpkg", package = "tidyterra"))
autoplot(v)
# With vectors
v <- vect(system.file("extdata/cyl.gpkg", package = "tidyterra"))
autoplot(v)
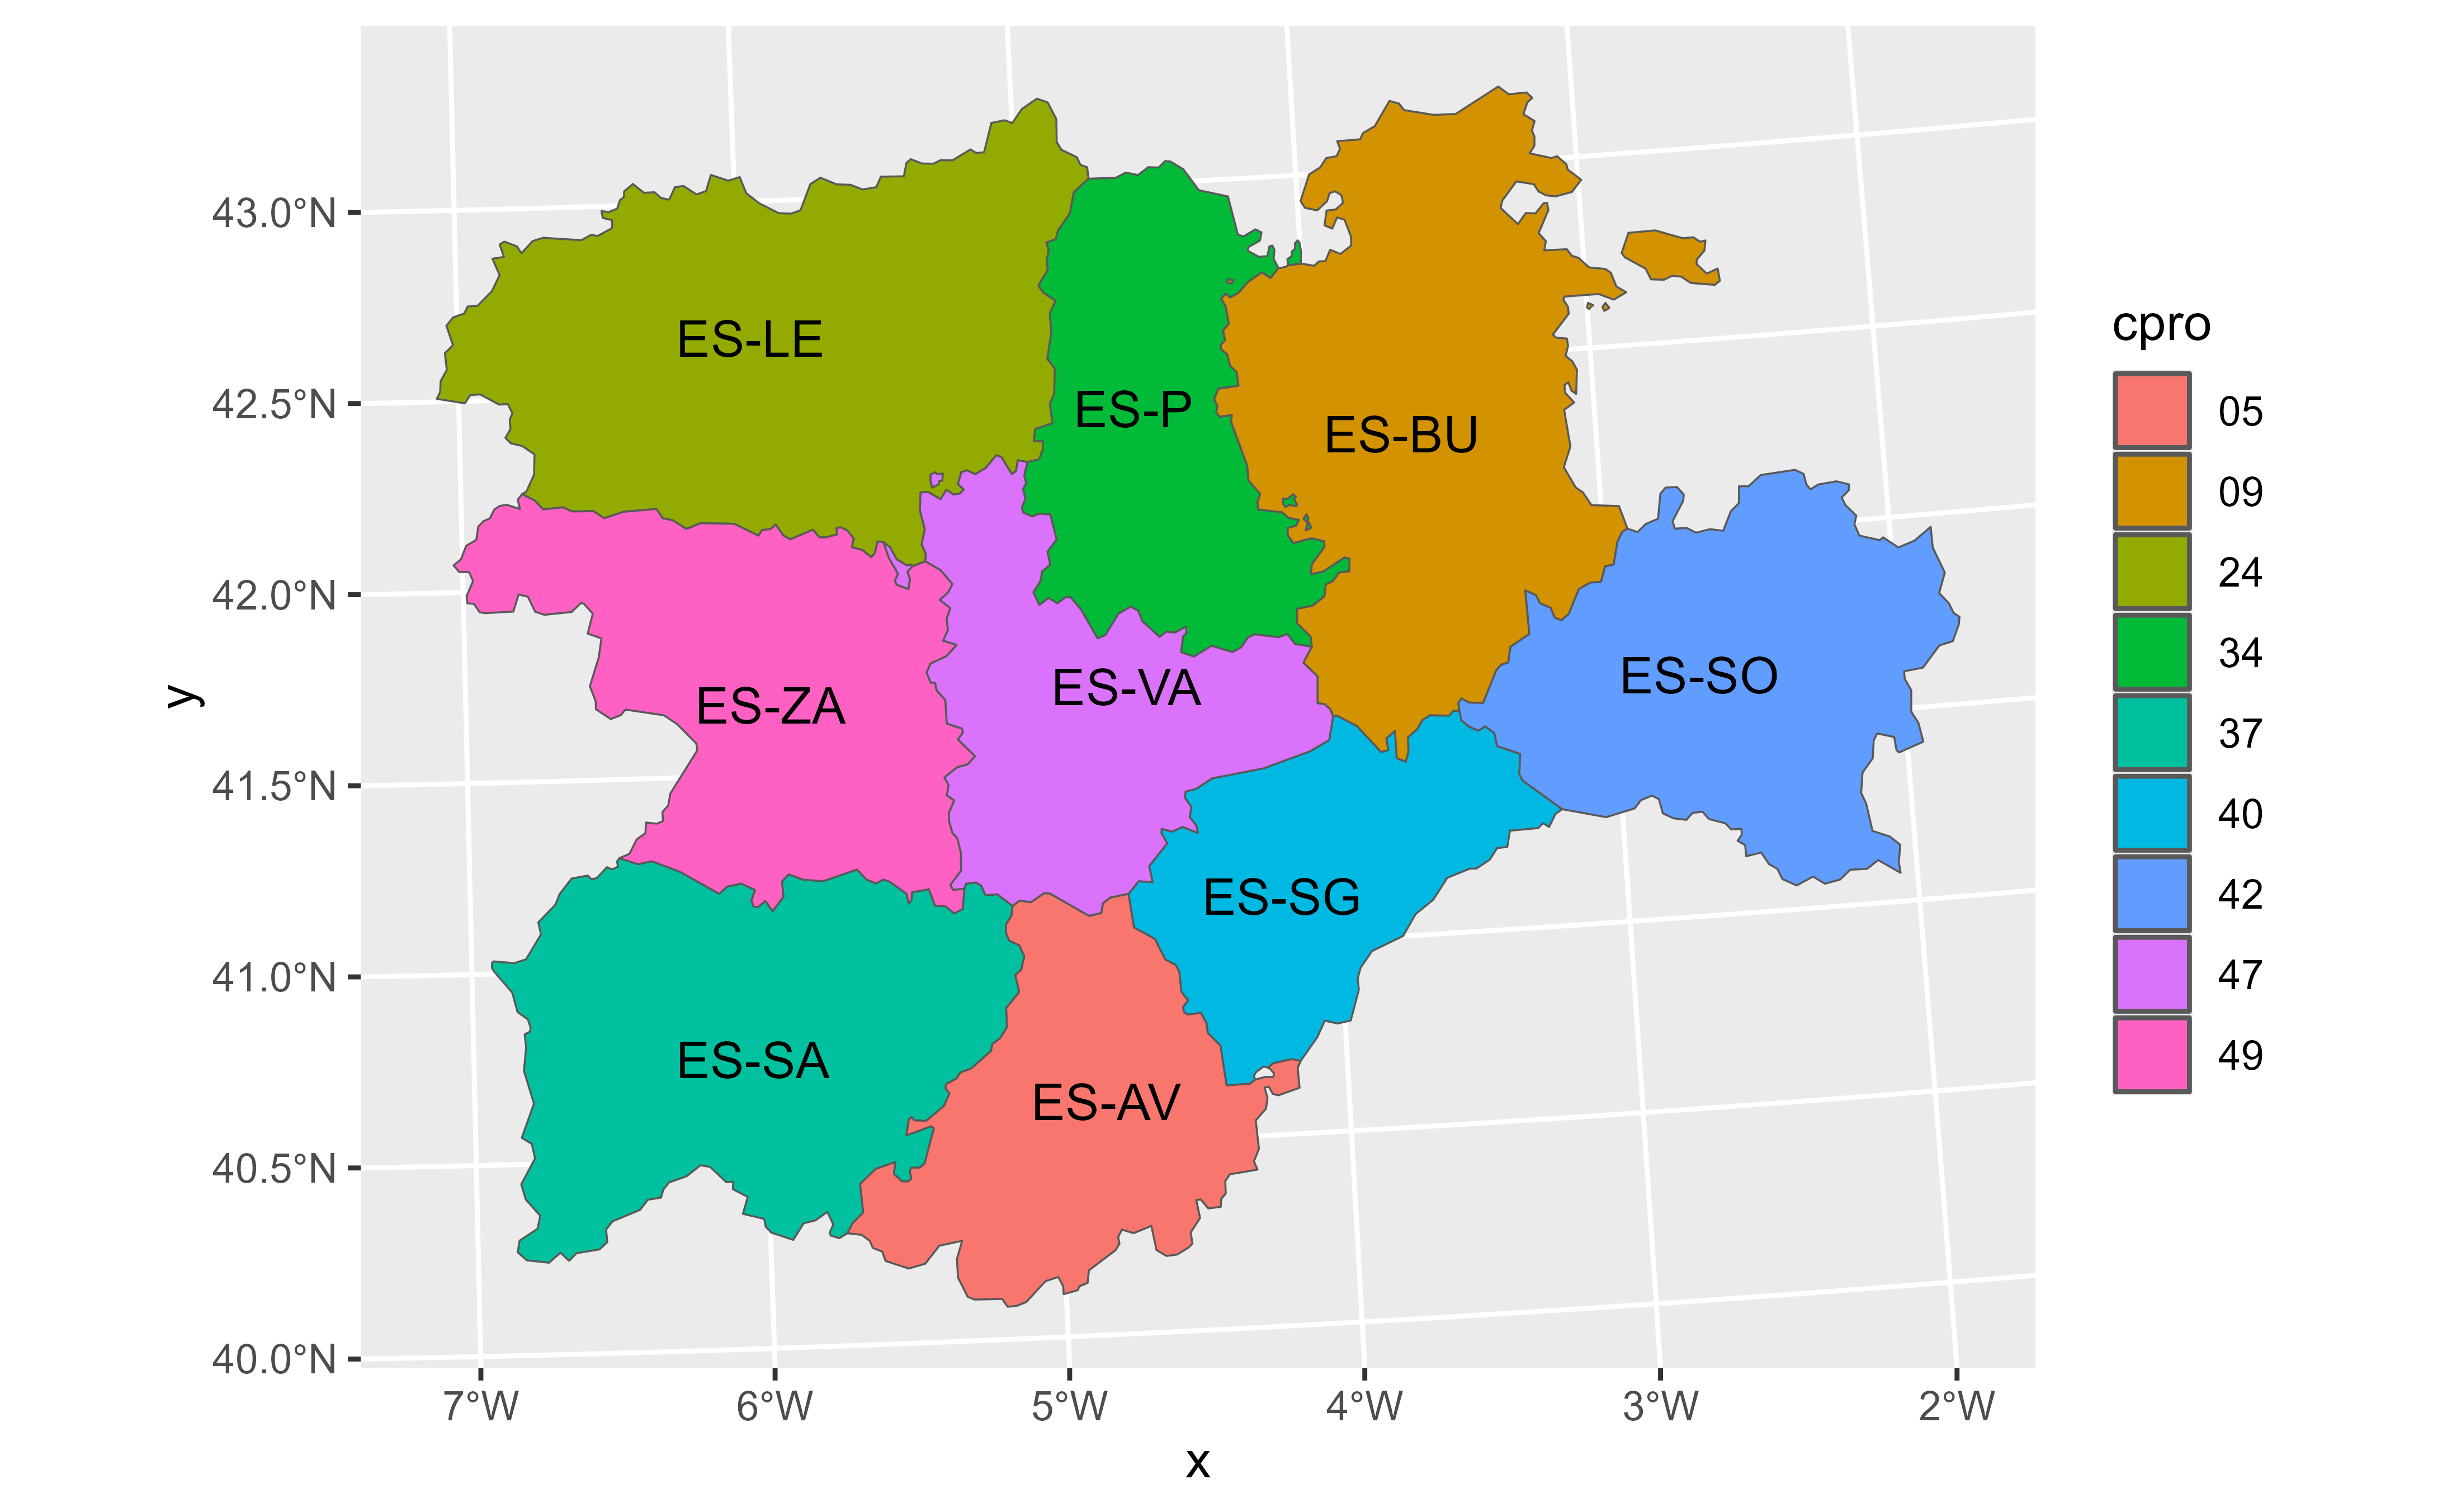
 v |> autoplot(aes(fill = cpro)) +
geom_spatvector_text(aes(label = iso2)) +
coord_sf(crs = 25829)
v |> autoplot(aes(fill = cpro)) +
geom_spatvector_text(aes(label = iso2)) +
coord_sf(crs = 25829)
 # }
# }