Wrappers of the ggplot2::geom_sf() family used to plot SpatVector
objects (see terra::vect()).
Usage
geom_spatvector(
  mapping = aes(),
  data = NULL,
  na.rm = FALSE,
  show.legend = NA,
  ...
)

geom_spatvector_label(
  mapping = aes(),
  data = NULL,
  na.rm = FALSE,
  show.legend = NA,
  ...,
  linewidth = 0.25,
  inherit.aes = TRUE
)

geom_spatvector_text(
  mapping = aes(),
  data = NULL,
  na.rm = FALSE,
  show.legend = NA,
  ...,
  check_overlap = FALSE,
  inherit.aes = TRUE
)

stat_spatvector(
  mapping = NULL,
  data = NULL,
  geom = "rect",
  position = "identity",
  na.rm = FALSE,
  show.legend = NA,
  inherit.aes = TRUE,
  ...
)
Arguments
- mapping
Set of aesthetic mappings created by
aes(). If specified andinherit.aes = TRUE(the default), it is combined with the default mapping at the top level of the plot. You must supplymappingif there is no plot mapping.- data
A
SpatVectorobject, seeterra::vect().- na.rm
If
FALSE, the default, missing values are removed with a warning. IfTRUE, missing values are silently removed.- show.legend
logical. Should this layer be included in the legends?
NA, the default, includes if any aesthetics are mapped.FALSEnever includes, andTRUEalways includes.You can also set this to one of "polygon", "line", and "point" to override the default legend.
- ...
Other arguments passed to
ggplot2::geom_sf()functions. These are often aesthetics, used to set an aesthetic to a fixed value, likecolour = "red"orlinewidth = 3.- linewidth
Size of label border, in mm.
- inherit.aes
If
FALSE, overrides the default aesthetics, rather than combining with them. This is most useful for helper functions that define both data and aesthetics and shouldn't inherit behaviour from the default plot specification, e.g.annotation_borders().- check_overlap
If
TRUE, text that overlaps previous text in the same layer will not be plotted.check_overlaphappens at draw time and in the order of the data. Therefore data should be arranged by the label column before callinggeom_text(). Note that this argument is not supported bygeom_label().- geom
The geometric object to use to display the data for this layer. When using a
stat_*()function to construct a layer, thegeomargument can be used to override the default coupling between stats and geoms. Thegeomargument accepts the following:A
Geomggproto subclass, for exampleGeomPoint.A string naming the geom. To give the geom as a string, strip the function name of the
geom_prefix. For example, to usegeom_point(), give the geom as"point".For more information and other ways to specify the geom, see the layer geom documentation.
- position
A position adjustment to use on the data for this layer. This can be used in various ways, including to prevent overplotting and improving the display. The
positionargument accepts the following:The result of calling a position function, such as
position_jitter(). This method allows for passing extra arguments to the position.A string naming the position adjustment. To give the position as a string, strip the function name of the
position_prefix. For example, to useposition_jitter(), give the position as"jitter".For more information and other ways to specify the position, see the layer position documentation.
Value
A ggplot2 layer.
Details
These functions are wrappers of ggplot2::geom_sf() functions. Since a
fortify.SpatVector() method is provided, ggplot2 treat a
SpatVector in the same way that a sf object. A side effect
is that you can use ggplot2::geom_sf() directly with SpatVector objects.
See ggplot2::geom_sf() for details on aesthetics, etc.
terra equivalent
Examples
# \donttest{
# Create a SpatVector
extfile <- system.file("extdata/cyl.gpkg", package = "tidyterra")
cyl <- terra::vect(extfile)
class(cyl)
#> [1] "SpatVector"
#> attr(,"package")
#> [1] "terra"
library(ggplot2)
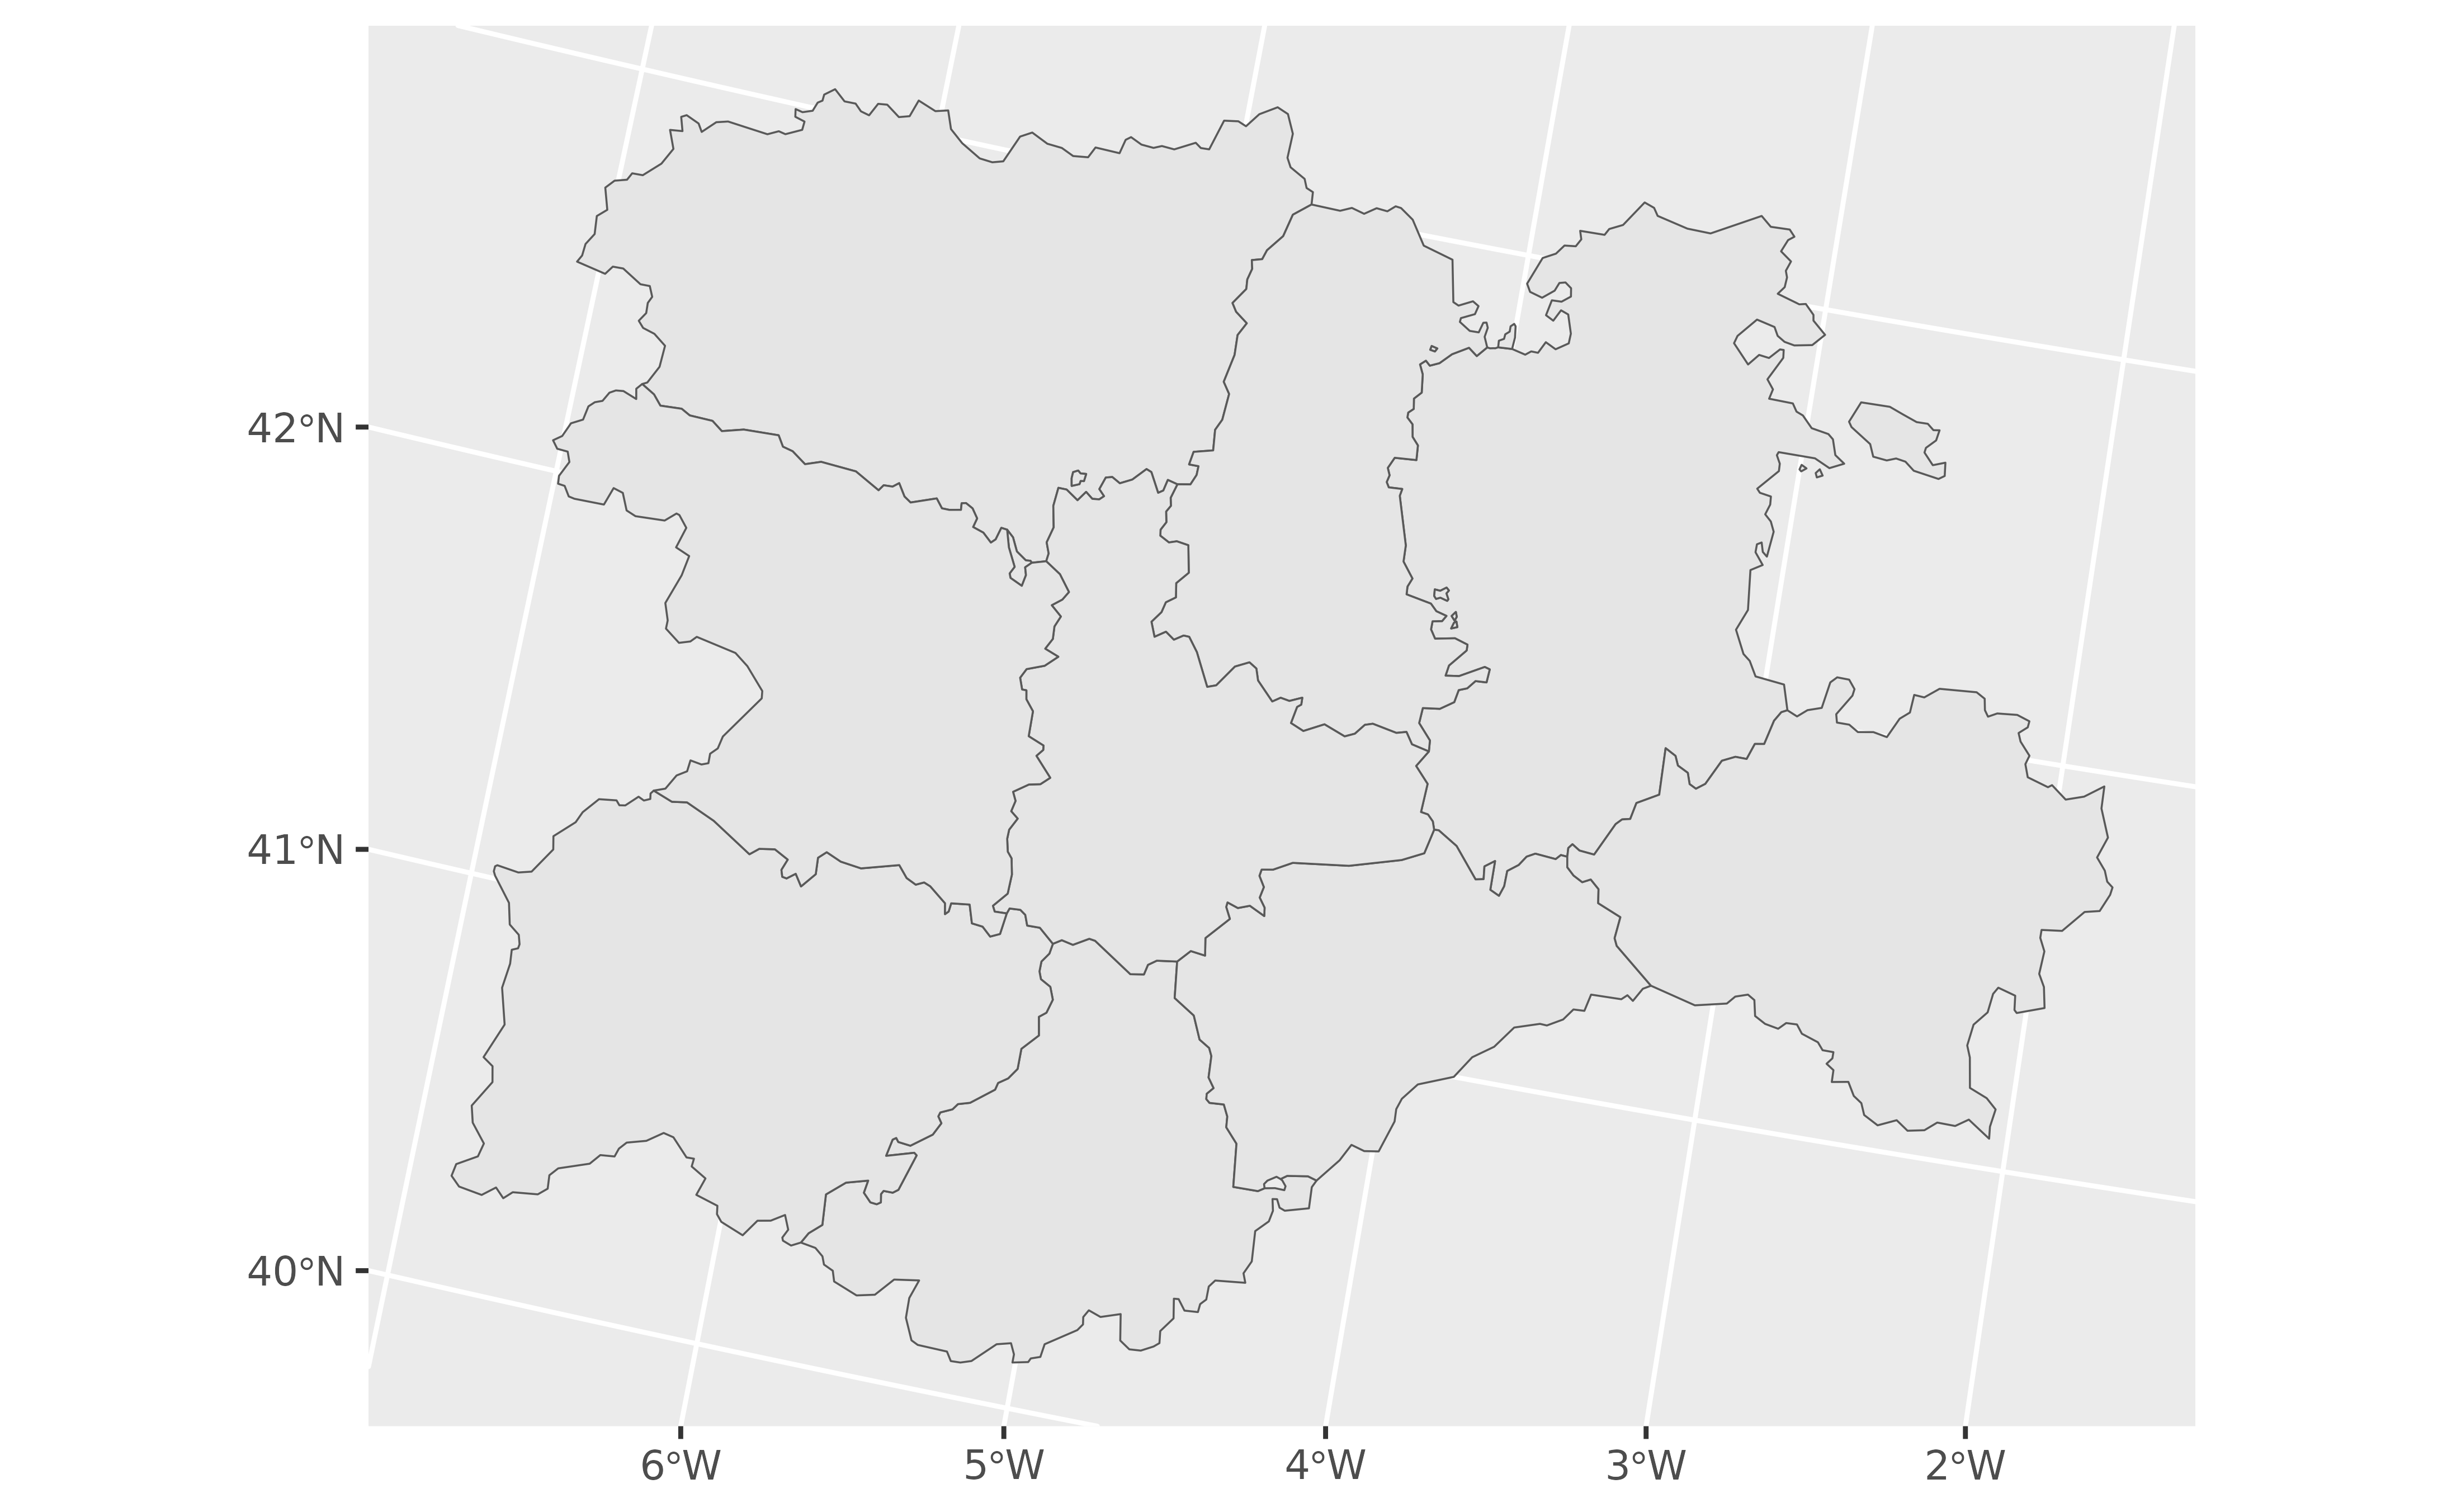
ggplot(cyl) +
geom_spatvector()
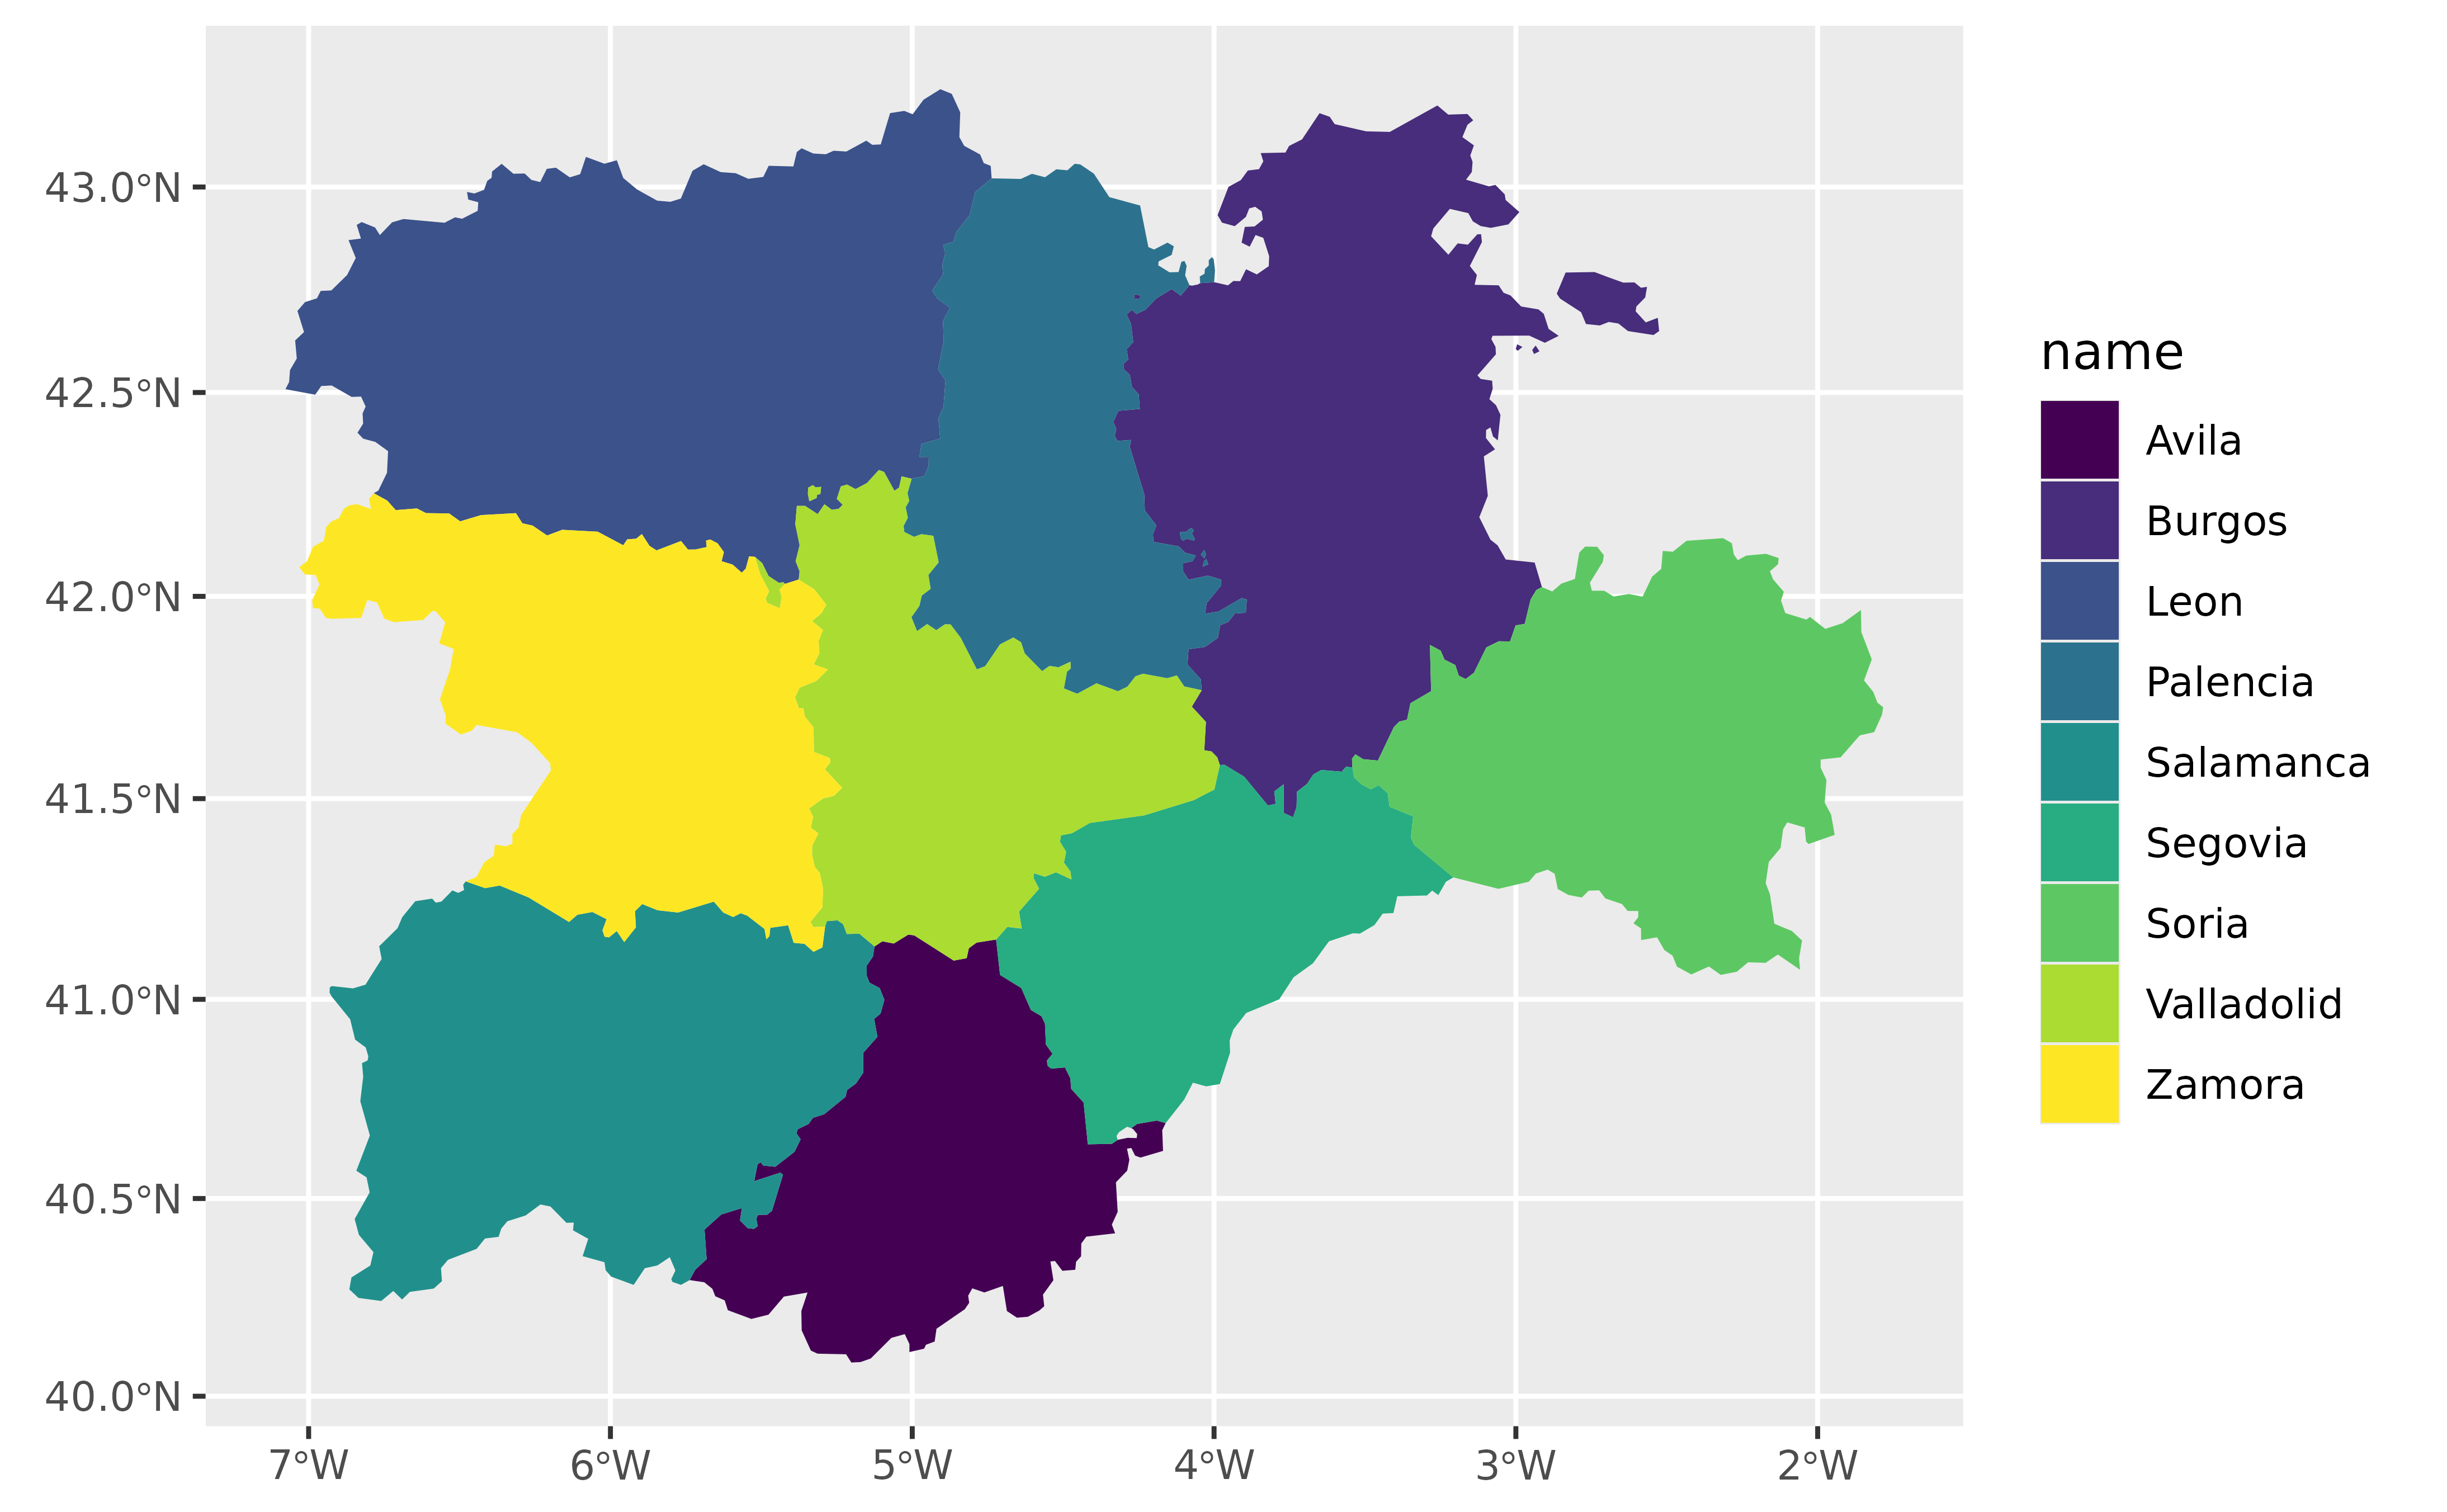
 # With params
ggplot(cyl) +
geom_spatvector(aes(fill = name), color = NA) +
scale_fill_viridis_d() +
coord_sf(crs = 3857)
# With params
ggplot(cyl) +
geom_spatvector(aes(fill = name), color = NA) +
scale_fill_viridis_d() +
coord_sf(crs = 3857)
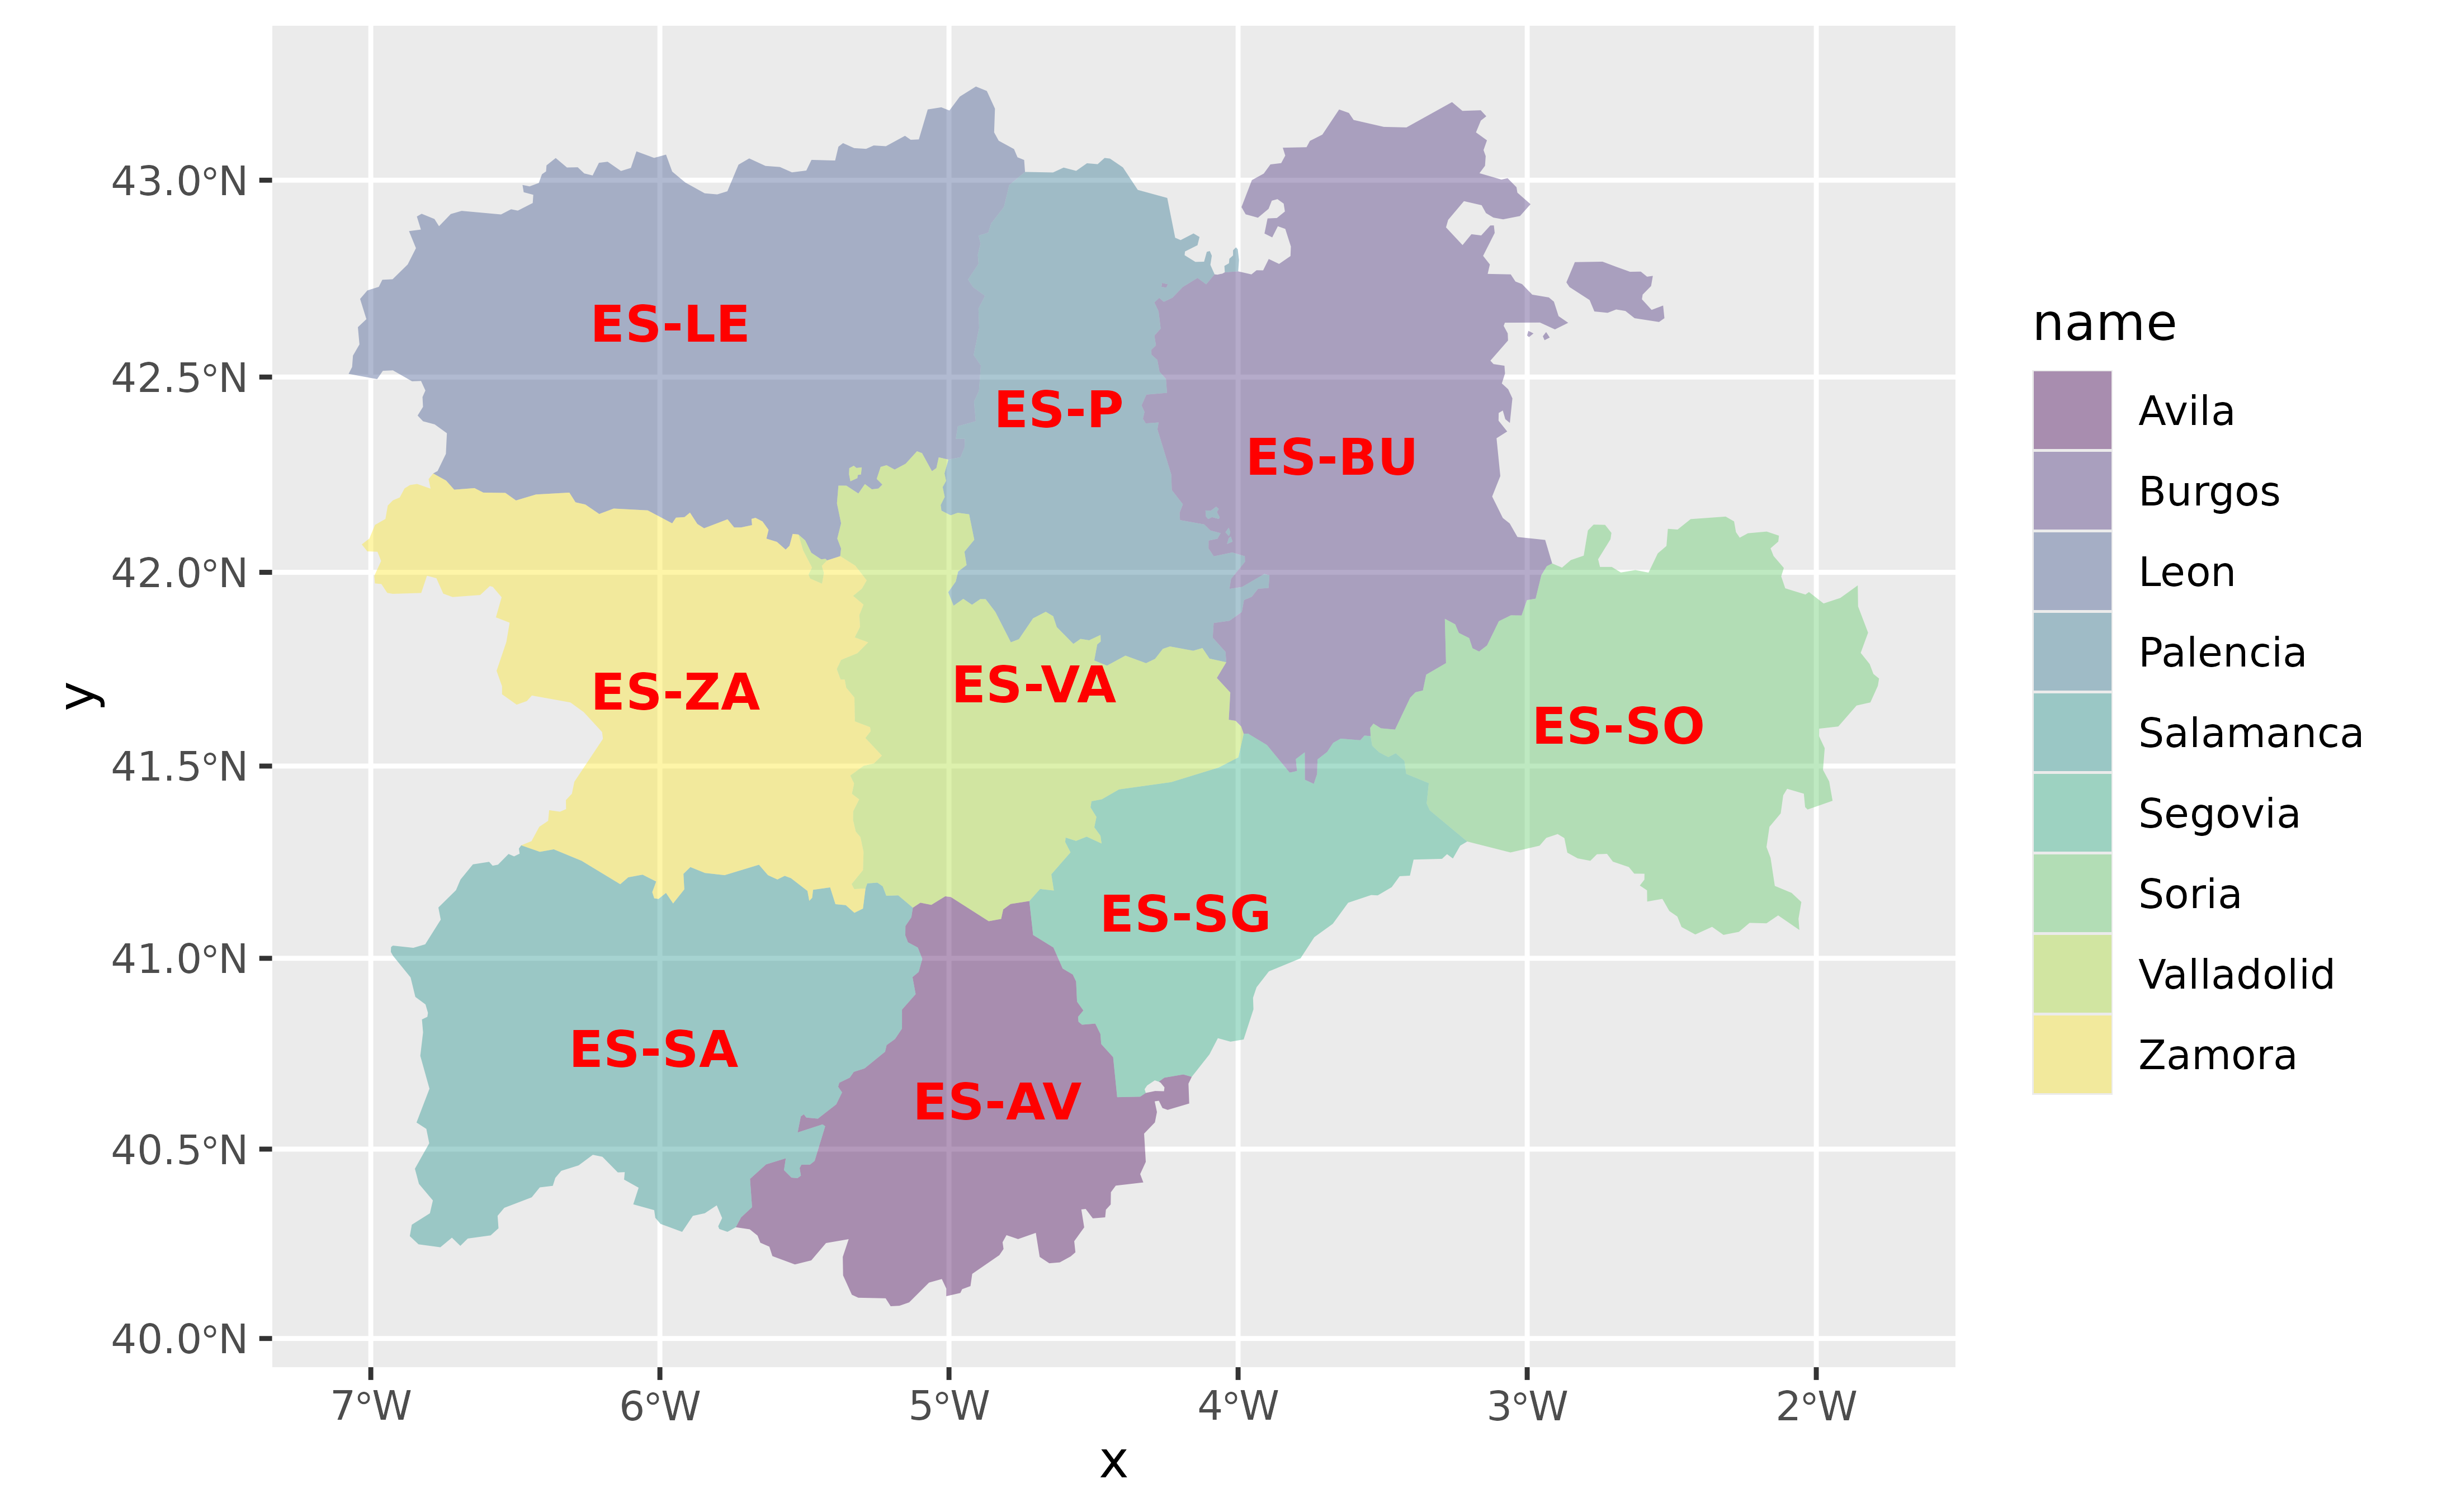
 # Add labels
ggplot(cyl) +
geom_spatvector(aes(fill = name), color = NA) +
geom_spatvector_text(aes(label = iso2),
fontface = "bold",
color = "red"
) +
scale_fill_viridis_d(alpha = 0.4) +
coord_sf(crs = 3857)
# Add labels
ggplot(cyl) +
geom_spatvector(aes(fill = name), color = NA) +
geom_spatvector_text(aes(label = iso2),
fontface = "bold",
color = "red"
) +
scale_fill_viridis_d(alpha = 0.4) +
coord_sf(crs = 3857)
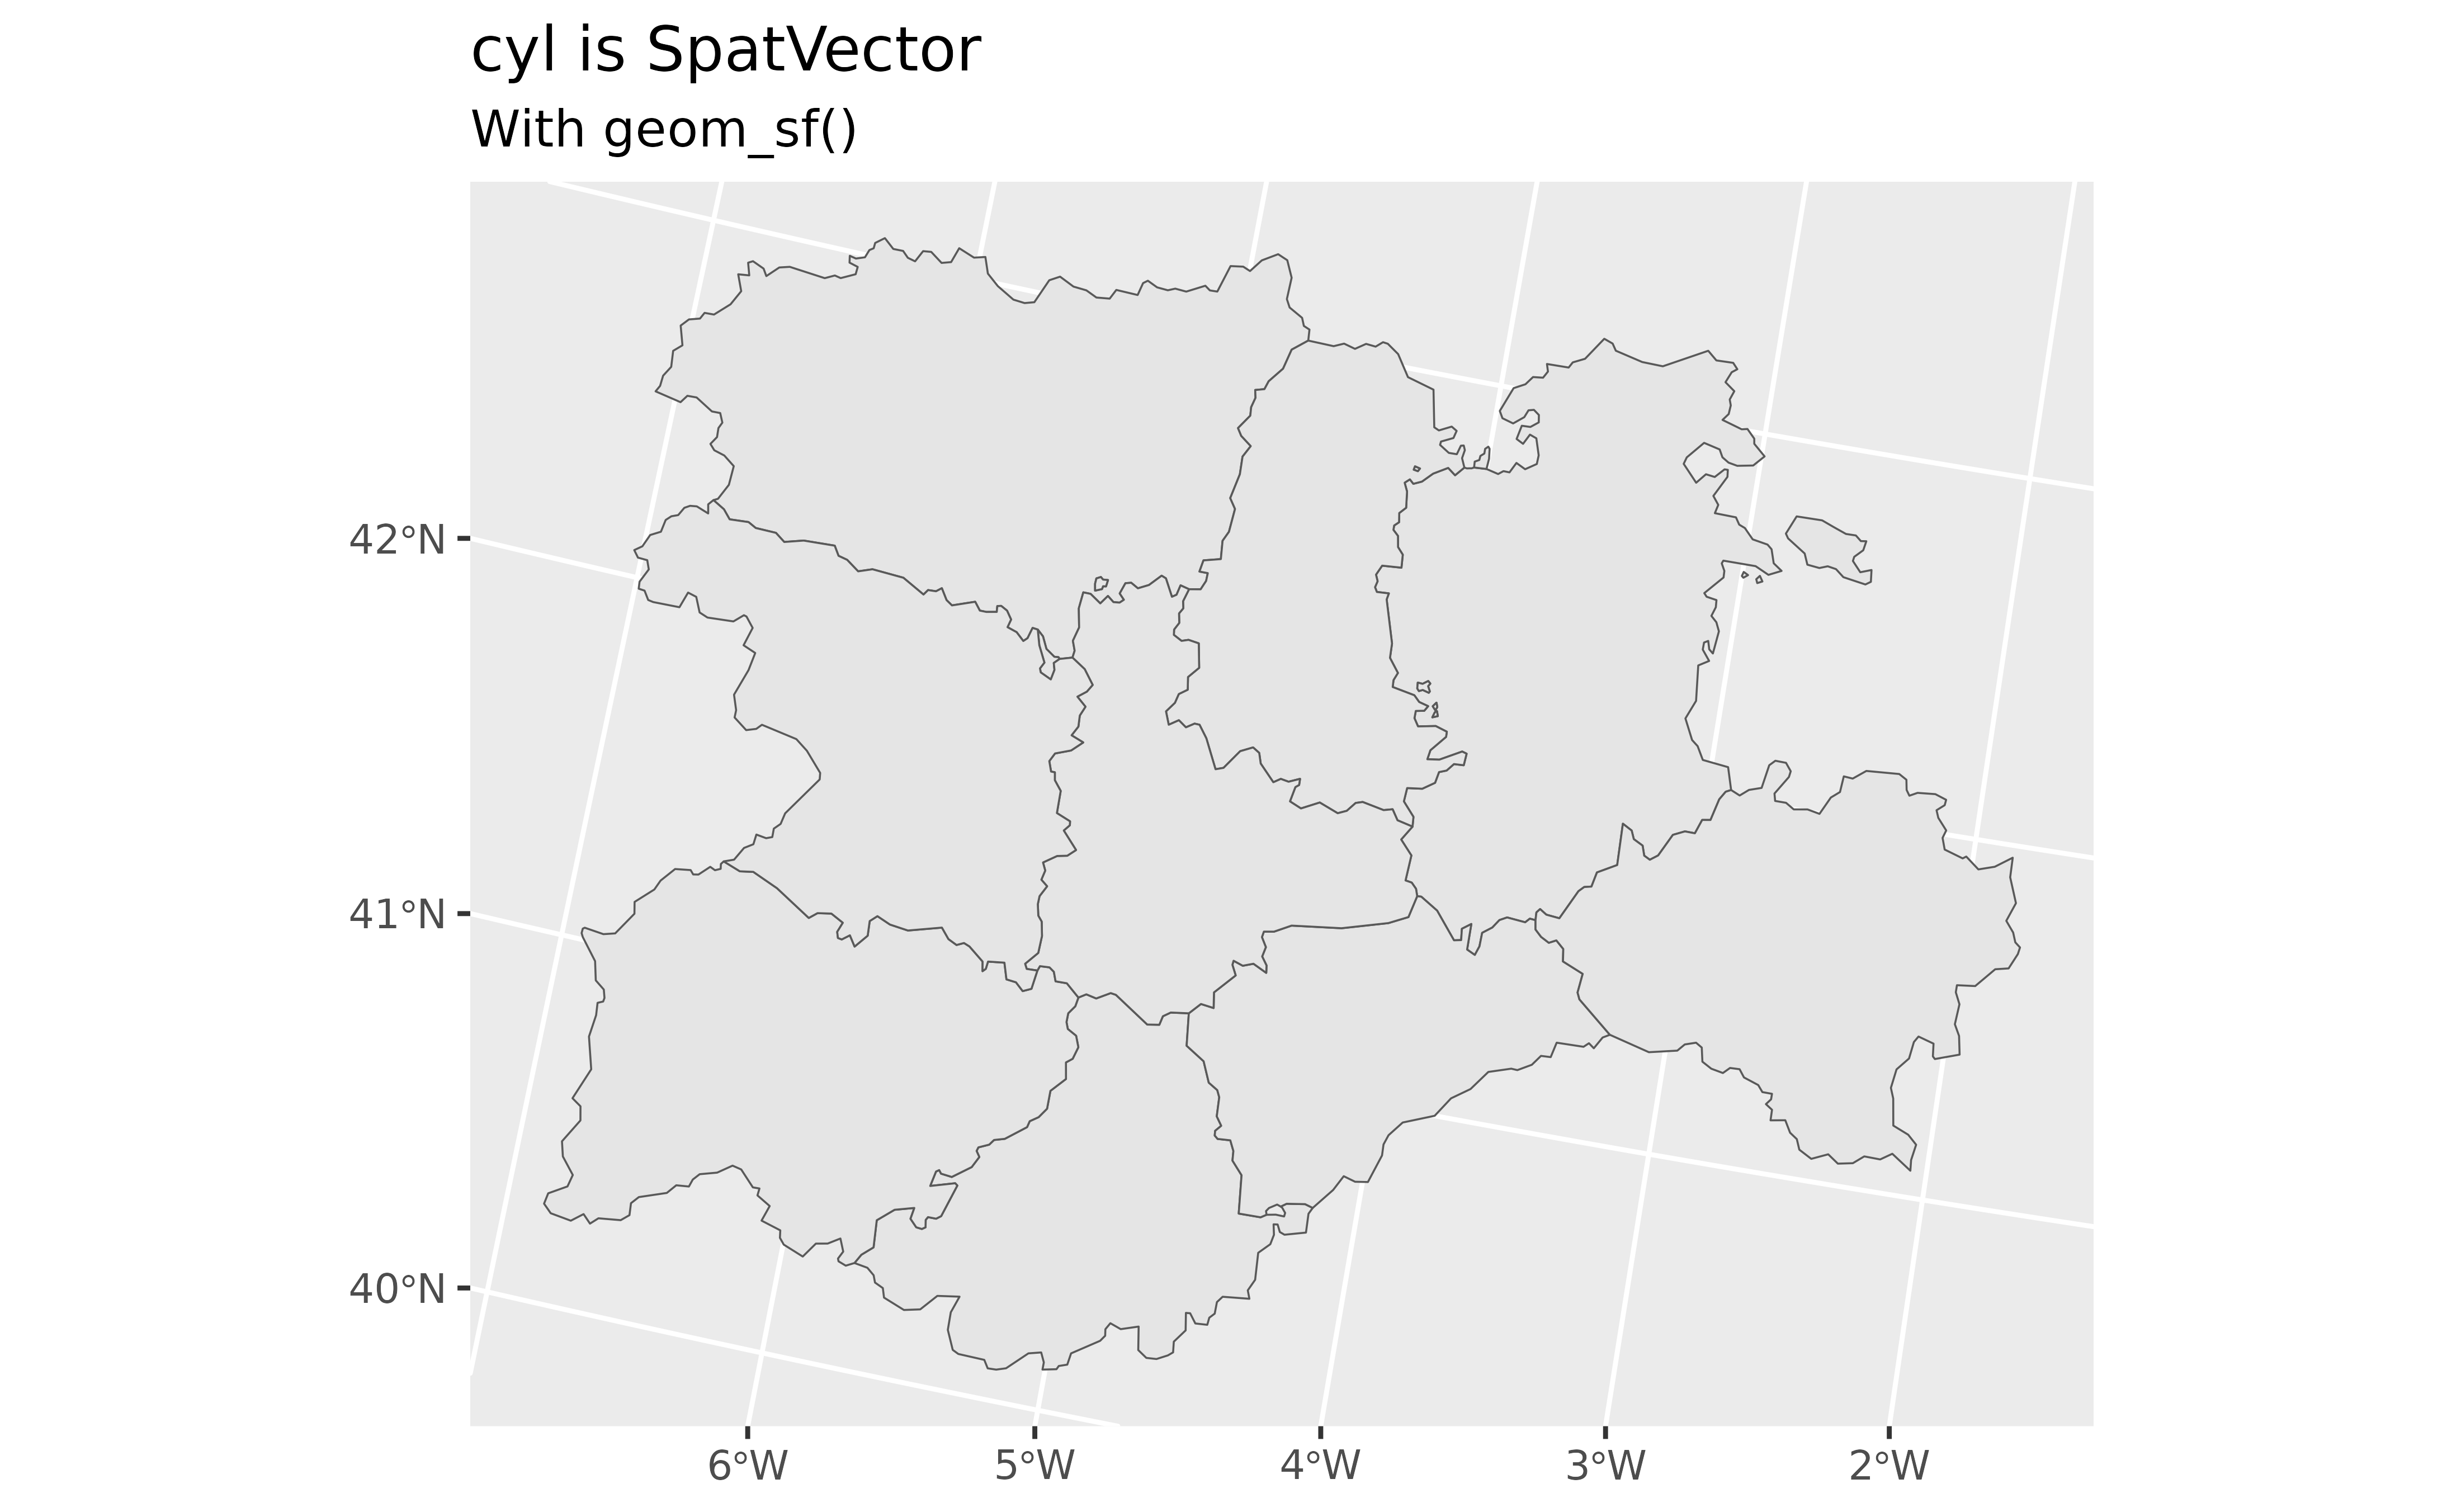
 # You can now use geom_sf() with SpatVector objects.
ggplot(cyl) +
geom_sf() +
labs(
title = paste("cyl is", as.character(class(cyl))),
subtitle = "With geom_sf()"
)
# You can now use geom_sf() with SpatVector objects.
ggplot(cyl) +
geom_sf() +
labs(
title = paste("cyl is", as.character(class(cyl))),
subtitle = "With geom_sf()"
)
 # }
# }