Plot SpatRaster contours
Source: R/geom-spat-contour.R, R/geom-spat-contour-text.R, R/geom-spat-contour-fill.R
geom_spat_contour.RdThese geoms create contours of SpatRaster objects. To specify a valid
surface, specify the layer in aes(z = layer_name); otherwise, all layers
are considered when creating contours. See also the Facets
section.
The underlying implementation is based on ggplot2::geom_contour().
geom_spatraster_contour_text() creates labeled contours and it is
implemented on top of isoband::isolines_grob().
Usage
geom_spatraster_contour(
  mapping = NULL,
  data,
  ...,
  maxcell = 5e+05,
  bins = NULL,
  binwidth = NULL,
  breaks = NULL,
  na.rm = TRUE,
  show.legend = NA,
  inherit.aes = TRUE,
  mask_projection = FALSE
)

geom_spatraster_contour_text(
  mapping = NULL,
  data,
  ...,
  maxcell = 5e+05,
  bins = NULL,
  binwidth = NULL,
  breaks = NULL,
  size.unit = "mm",
  label_format = scales::label_number(),
  label_placer = isoband::label_placer_minmax(),
  na.rm = TRUE,
  show.legend = NA,
  inherit.aes = TRUE,
  mask_projection = FALSE
)

geom_spatraster_contour_filled(
  mapping = NULL,
  data,
  ...,
  maxcell = 5e+05,
  bins = NULL,
  binwidth = NULL,
  breaks = NULL,
  na.rm = TRUE,
  show.legend = NA,
  inherit.aes = TRUE,
  mask_projection = FALSE
)
Arguments
- mapping
Set of aesthetic mappings created by
ggplot2::aes(). See Aesthetics, especially in the use of thefillaesthetic.- data
A
SpatRasterobject.- ...
Other arguments passed on to
layer()'sparamsargument. These arguments broadly fall into one of 4 categories below. Notably, further arguments to thepositionargument, or aesthetics that are required can not be passed through.... Unknown arguments that are not part of the 4 categories below are ignored.Static aesthetics that are not mapped to a scale, but are at a fixed value and apply to the layer as a whole. For example,
colour = "red"orlinewidth = 3. The geom's documentation has an Aesthetics section that lists the available options. The 'required' aesthetics cannot be passed on to theparams. Please note that while passing unmapped aesthetics as vectors is technically possible, the order and required length is not guaranteed to be parallel to the input data.When constructing a layer using a
stat_*()function, the...argument can be used to pass on parameters to thegeompart of the layer. An example of this isstat_density(geom = "area", outline.type = "both"). The geom's documentation lists which parameters it can accept.Inversely, when constructing a layer using a
geom_*()function, the...argument can be used to pass on parameters to thestatpart of the layer. An example of this isgeom_area(stat = "density", adjust = 0.5). The stat's documentation lists which parameters it can accept.The
key_glyphargument oflayer()may also be passed on through.... This can be one of the functions described as key glyphs, to change the display of the layer in the legend.
- maxcell
Positive integer. Maximum number of cells to use for the plot.
- bins
Number of contour bins. Overridden by
breaks.- binwidth
The width of the contour bins. Overridden by
bins.- breaks
One of:
Numeric vector to set the contour breaks
A function that takes the range of the data and binwidth as input and returns breaks as output. A function can be created from a formula (e.g. ~ fullseq(.x, .y)).
Overrides
binwidthandbins. By default, this is a vector of length ten withpretty()breaks.- na.rm
If
TRUE, the default, missing values are silently removed. IfFALSE, missing values are removed with a warning.- show.legend
logical. Should this layer be included in the legends?
NA, the default, includes if any aesthetics are mapped.FALSEnever includes, andTRUEalways includes. It can also be a named logical vector to finely select the aesthetics to display. To include legend keys for all levels, even when no data exists, useTRUE. IfNA, all levels are shown in legend, but unobserved levels are omitted.- inherit.aes
If
FALSE, override the default aesthetics rather than combining with them.- mask_projection
Logical, defaults to
FALSE. IfTRUE, mask out areas outside the input extent. For example, to avoid data wrapping around the dateline in equal-area projections. This argument is passed toterra::project()when reprojecting theSpatRaster.- size.unit
How the
sizeaesthetic is interpreted: as millimetres ("mm", default), points ("pt"), centimetres ("cm"), inches ("in"), or picas ("pc").- label_format
One of:
NULLfor no labels. This produces the same result asgeom_spatraster_contour().A character vector giving labels (must have the same length as the breaks produced by
bins,binwidthorbreaks).A function that takes the breaks as input and returns labels as output, as in the default setup (
scales::label_number()).
- label_placer
Function that controls how labels are placed along the isolines. Uses
label_placer_minmax()by default.
Value
A ggplot2 layer.
terra equivalent
Aesthetics
geom_spatraster_contour() and geom_spatraster_contour_text() understand
the following aesthetics:
geom_spatraster_contour_text() also understands:
labelfamilyfontface
In addition to the aesthetics listed above,
geom_spatraster_contour_filled() understands:
subgroup
Check ggplot2::geom_contour() for more information on contours and
vignette("ggplot2-specs", package = "ggplot2") for an overview of the
aesthetics.
Computed variables
These geoms compute variables internally that are available for use as
aesthetics, using (for example) aes(color = after_stat(<computed>)) (see
ggplot2::after_stat()).
after_stat(lyr): Name of the layer.after_stat(level): Height of contour. For contour lines, this is a numeric vector that represents bin boundaries. For contour bands, this is an ordered factor that represents bin ranges.after_stat(nlevel): Height of contour, scaled to maximum of 1.after_stat(level_low),after_stat(level_high)andafter_stat(level_mid): For contour bands only, the lower and upper bin boundaries and the midpoint between them.
Dropped variables
z: After contouring, thezvalues of individual data points are no longer available.
Coordinates
When the SpatRaster does not have a CRS, that is,
terra::crs(rast) == "", the geom does not make any assumption about the
scales.
On SpatRaster objects that have a CRS, the geom uses
ggplot2::coord_sf() to adjust the scales. This means that the
SpatRaster may be reprojected.
Facets
You can use facet_wrap(~lyr) to create a faceted plot for each layer of
the SpatRaster object. See ggplot2::facet_wrap() for details.
See also
The metR package also provides a set of alternative functions:
Other ggplot2 helpers:
autoplot.Spat,
fortify.Spat,
geom_spatraster(),
geom_spatraster_rgb(),
ggspatvector,
stat_spat_coordinates()
Examples
# \donttest{
library(terra)
# Raster
f <- system.file("extdata/volcano2.tif", package = "tidyterra")
r <- rast(f)
library(ggplot2)
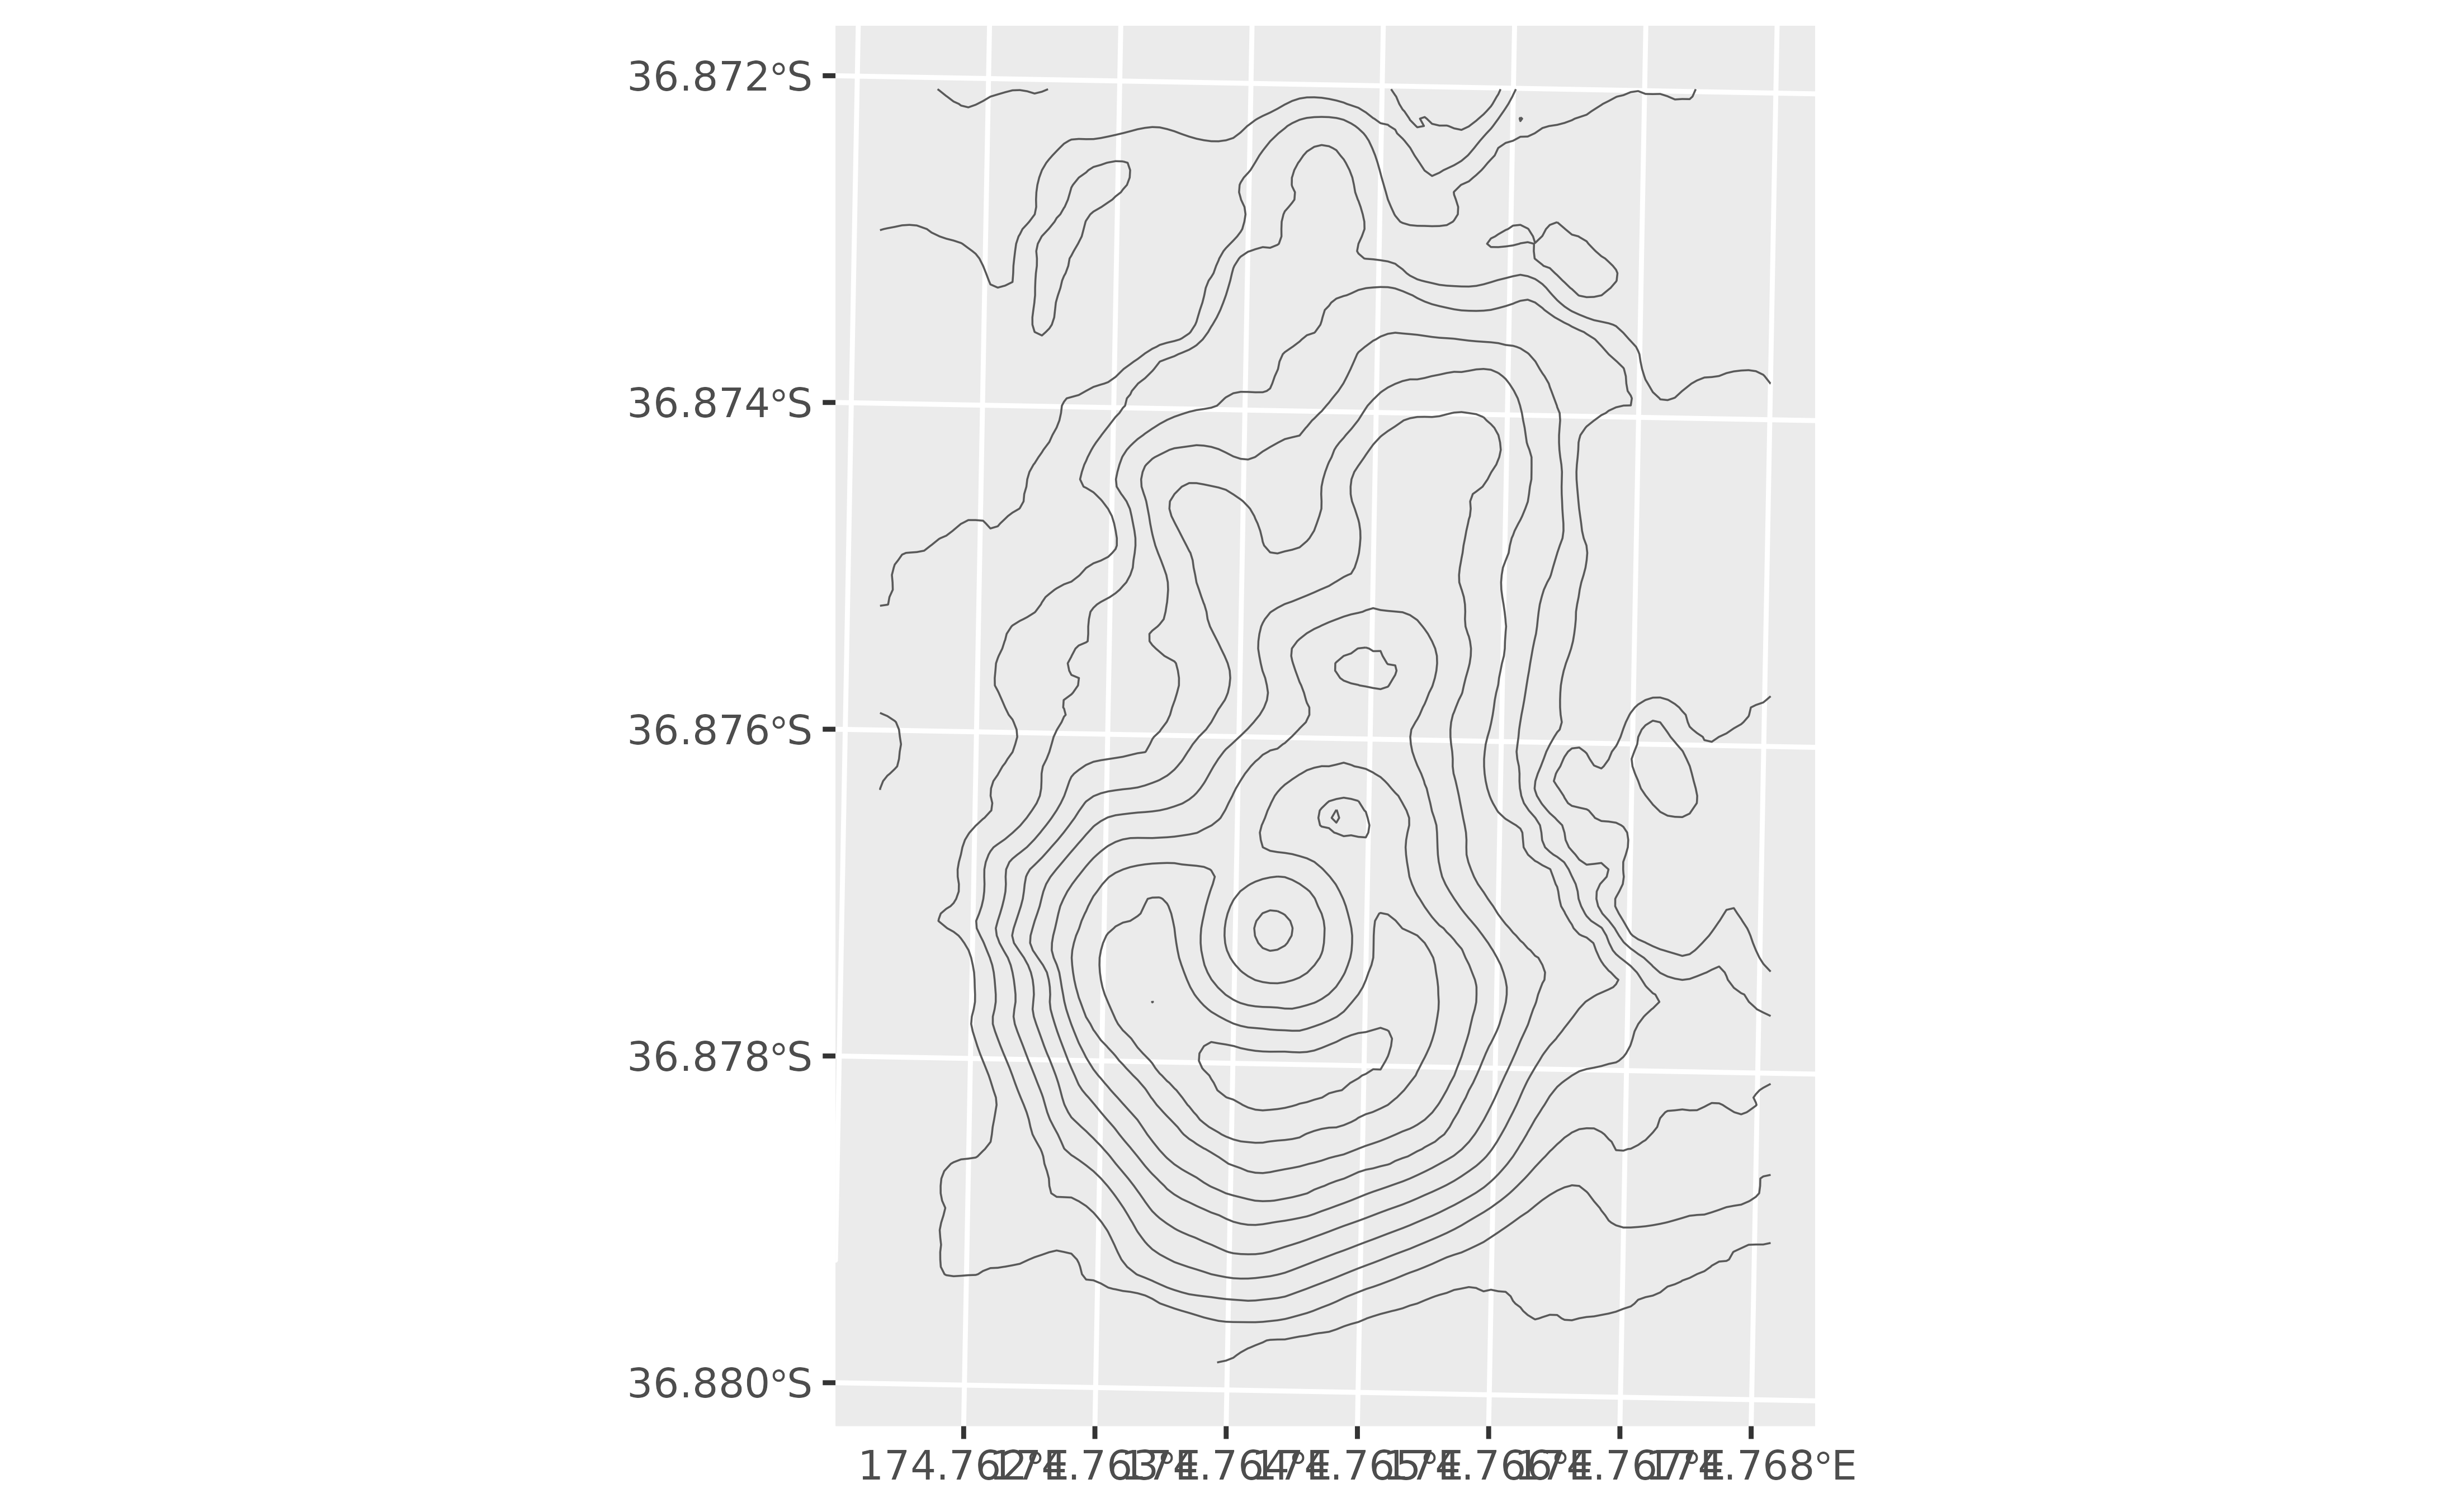
ggplot() +
geom_spatraster_contour(data = r)
 # Labeled
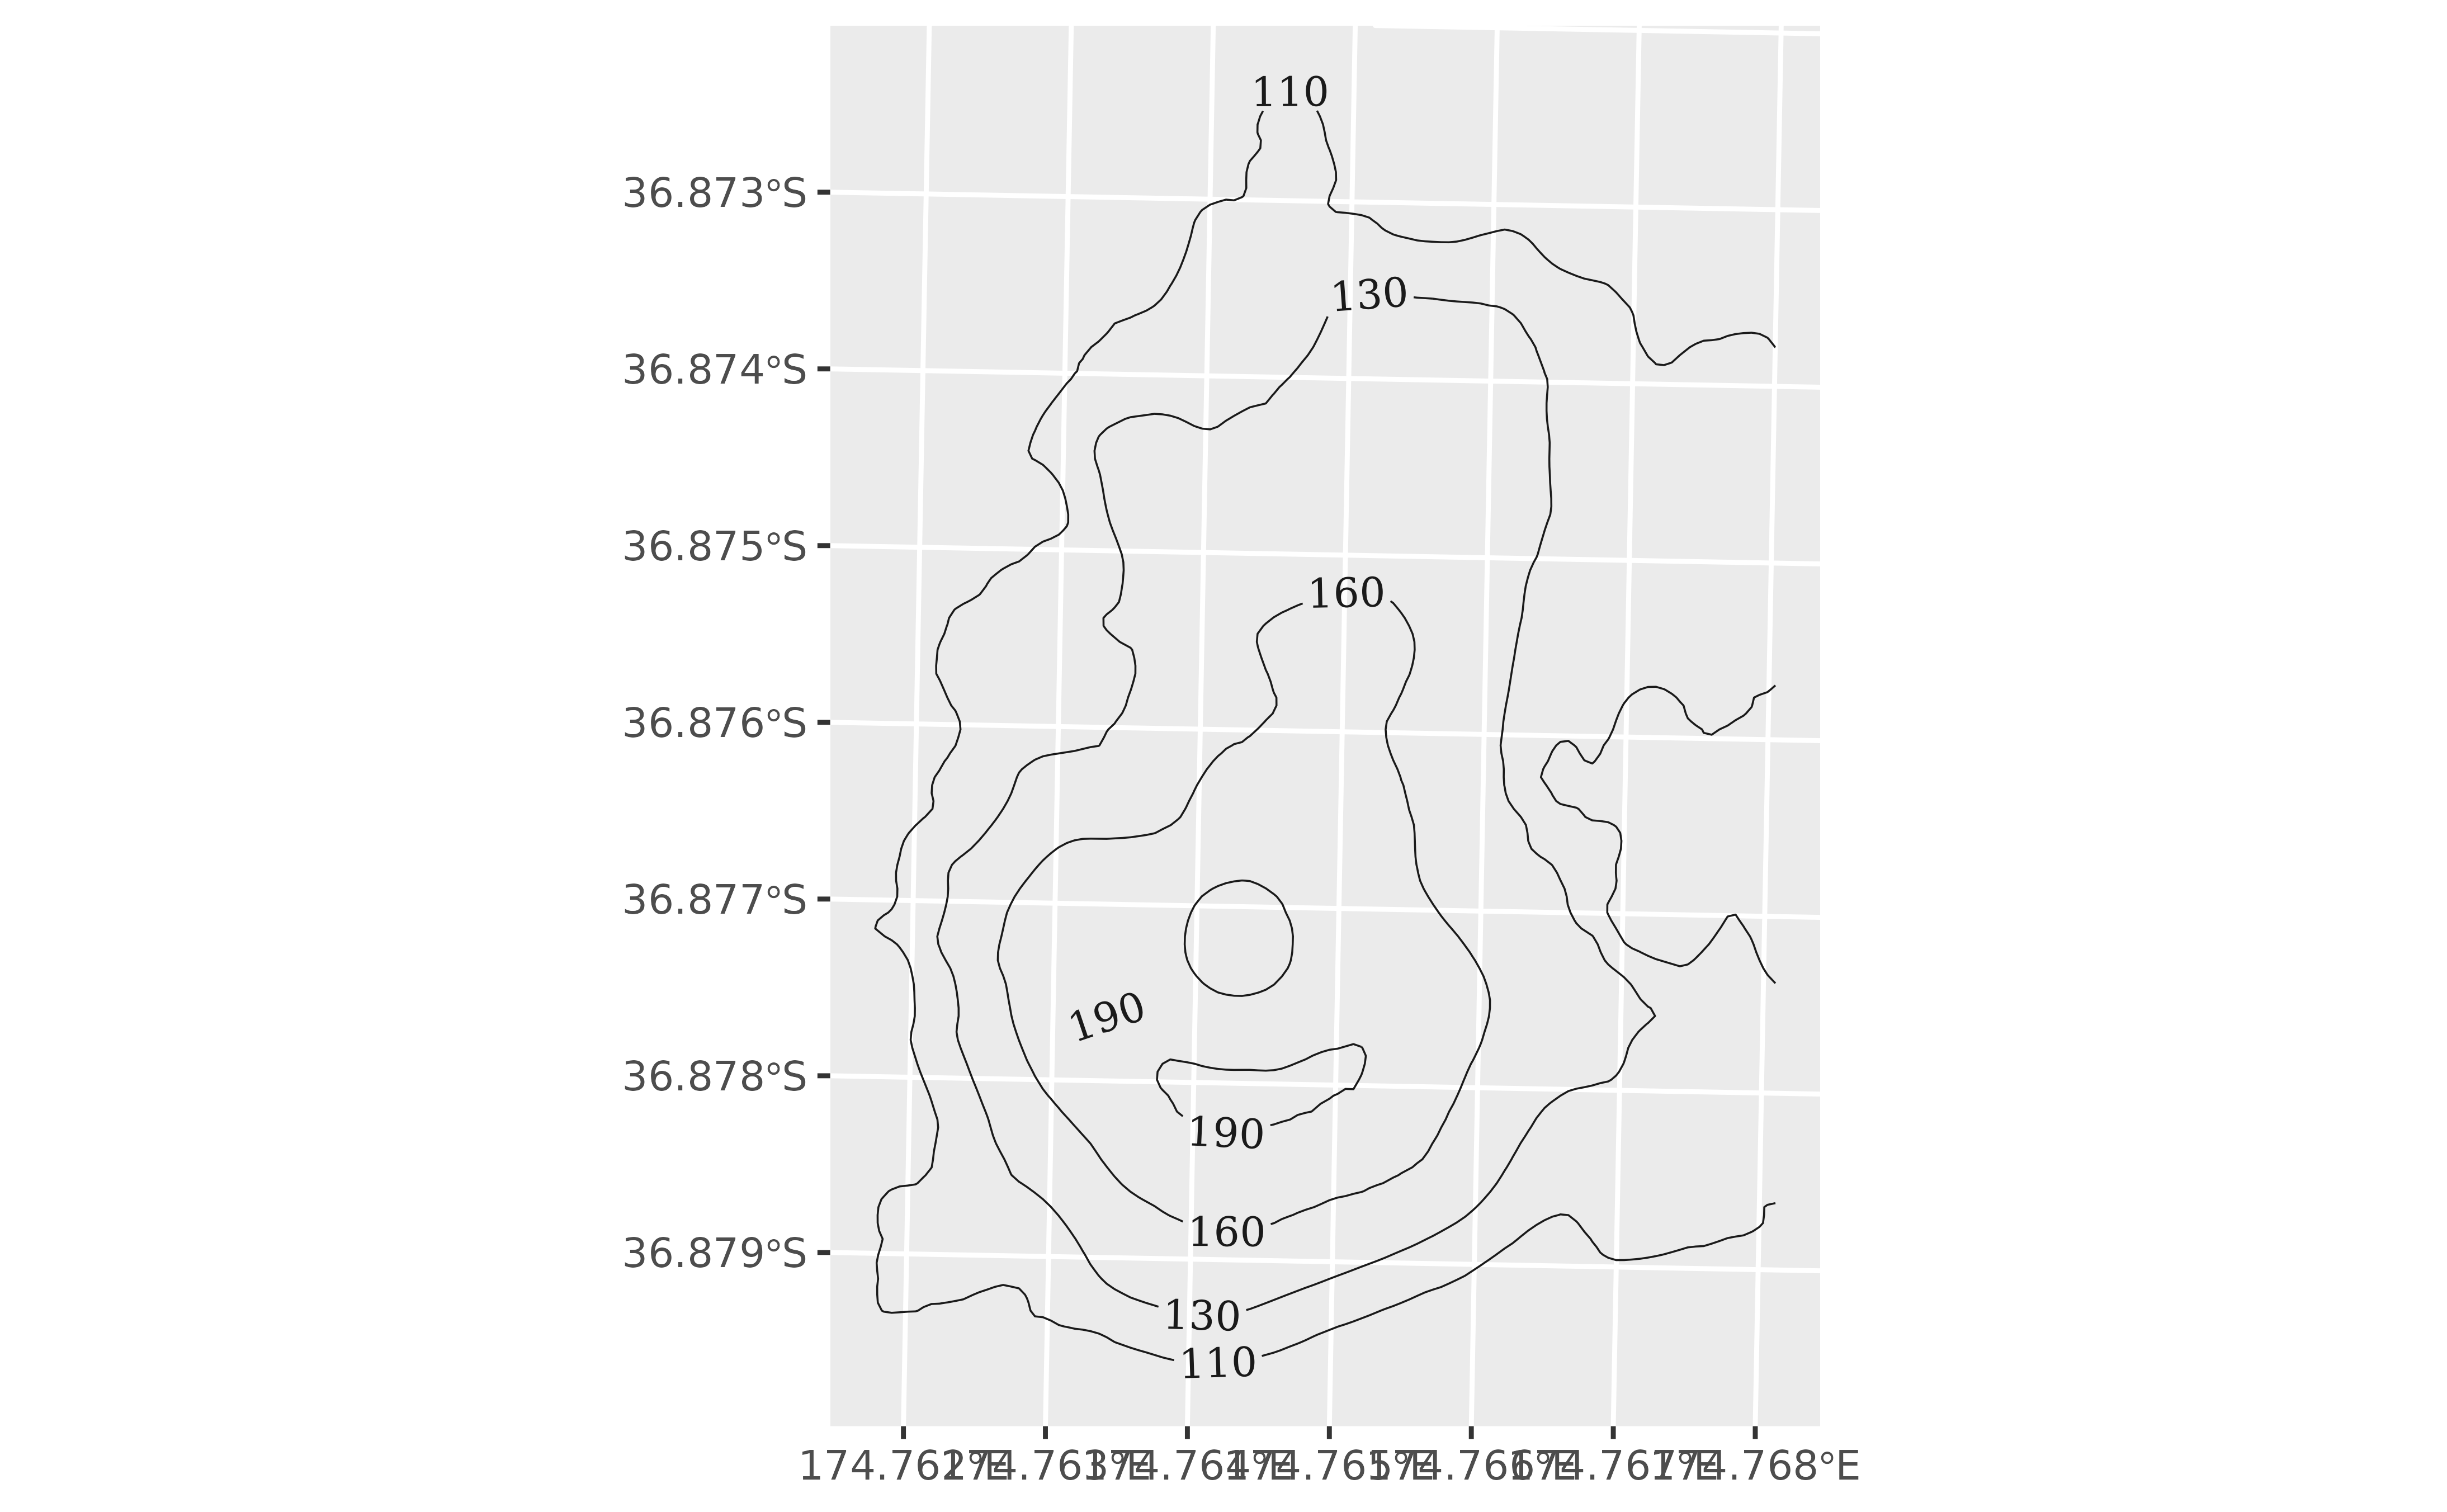
ggplot() +
geom_spatraster_contour_text(
data = r, breaks = c(110, 130, 160, 190),
color = "grey10", family = "serif"
)
# Labeled
ggplot() +
geom_spatraster_contour_text(
data = r, breaks = c(110, 130, 160, 190),
color = "grey10", family = "serif"
)
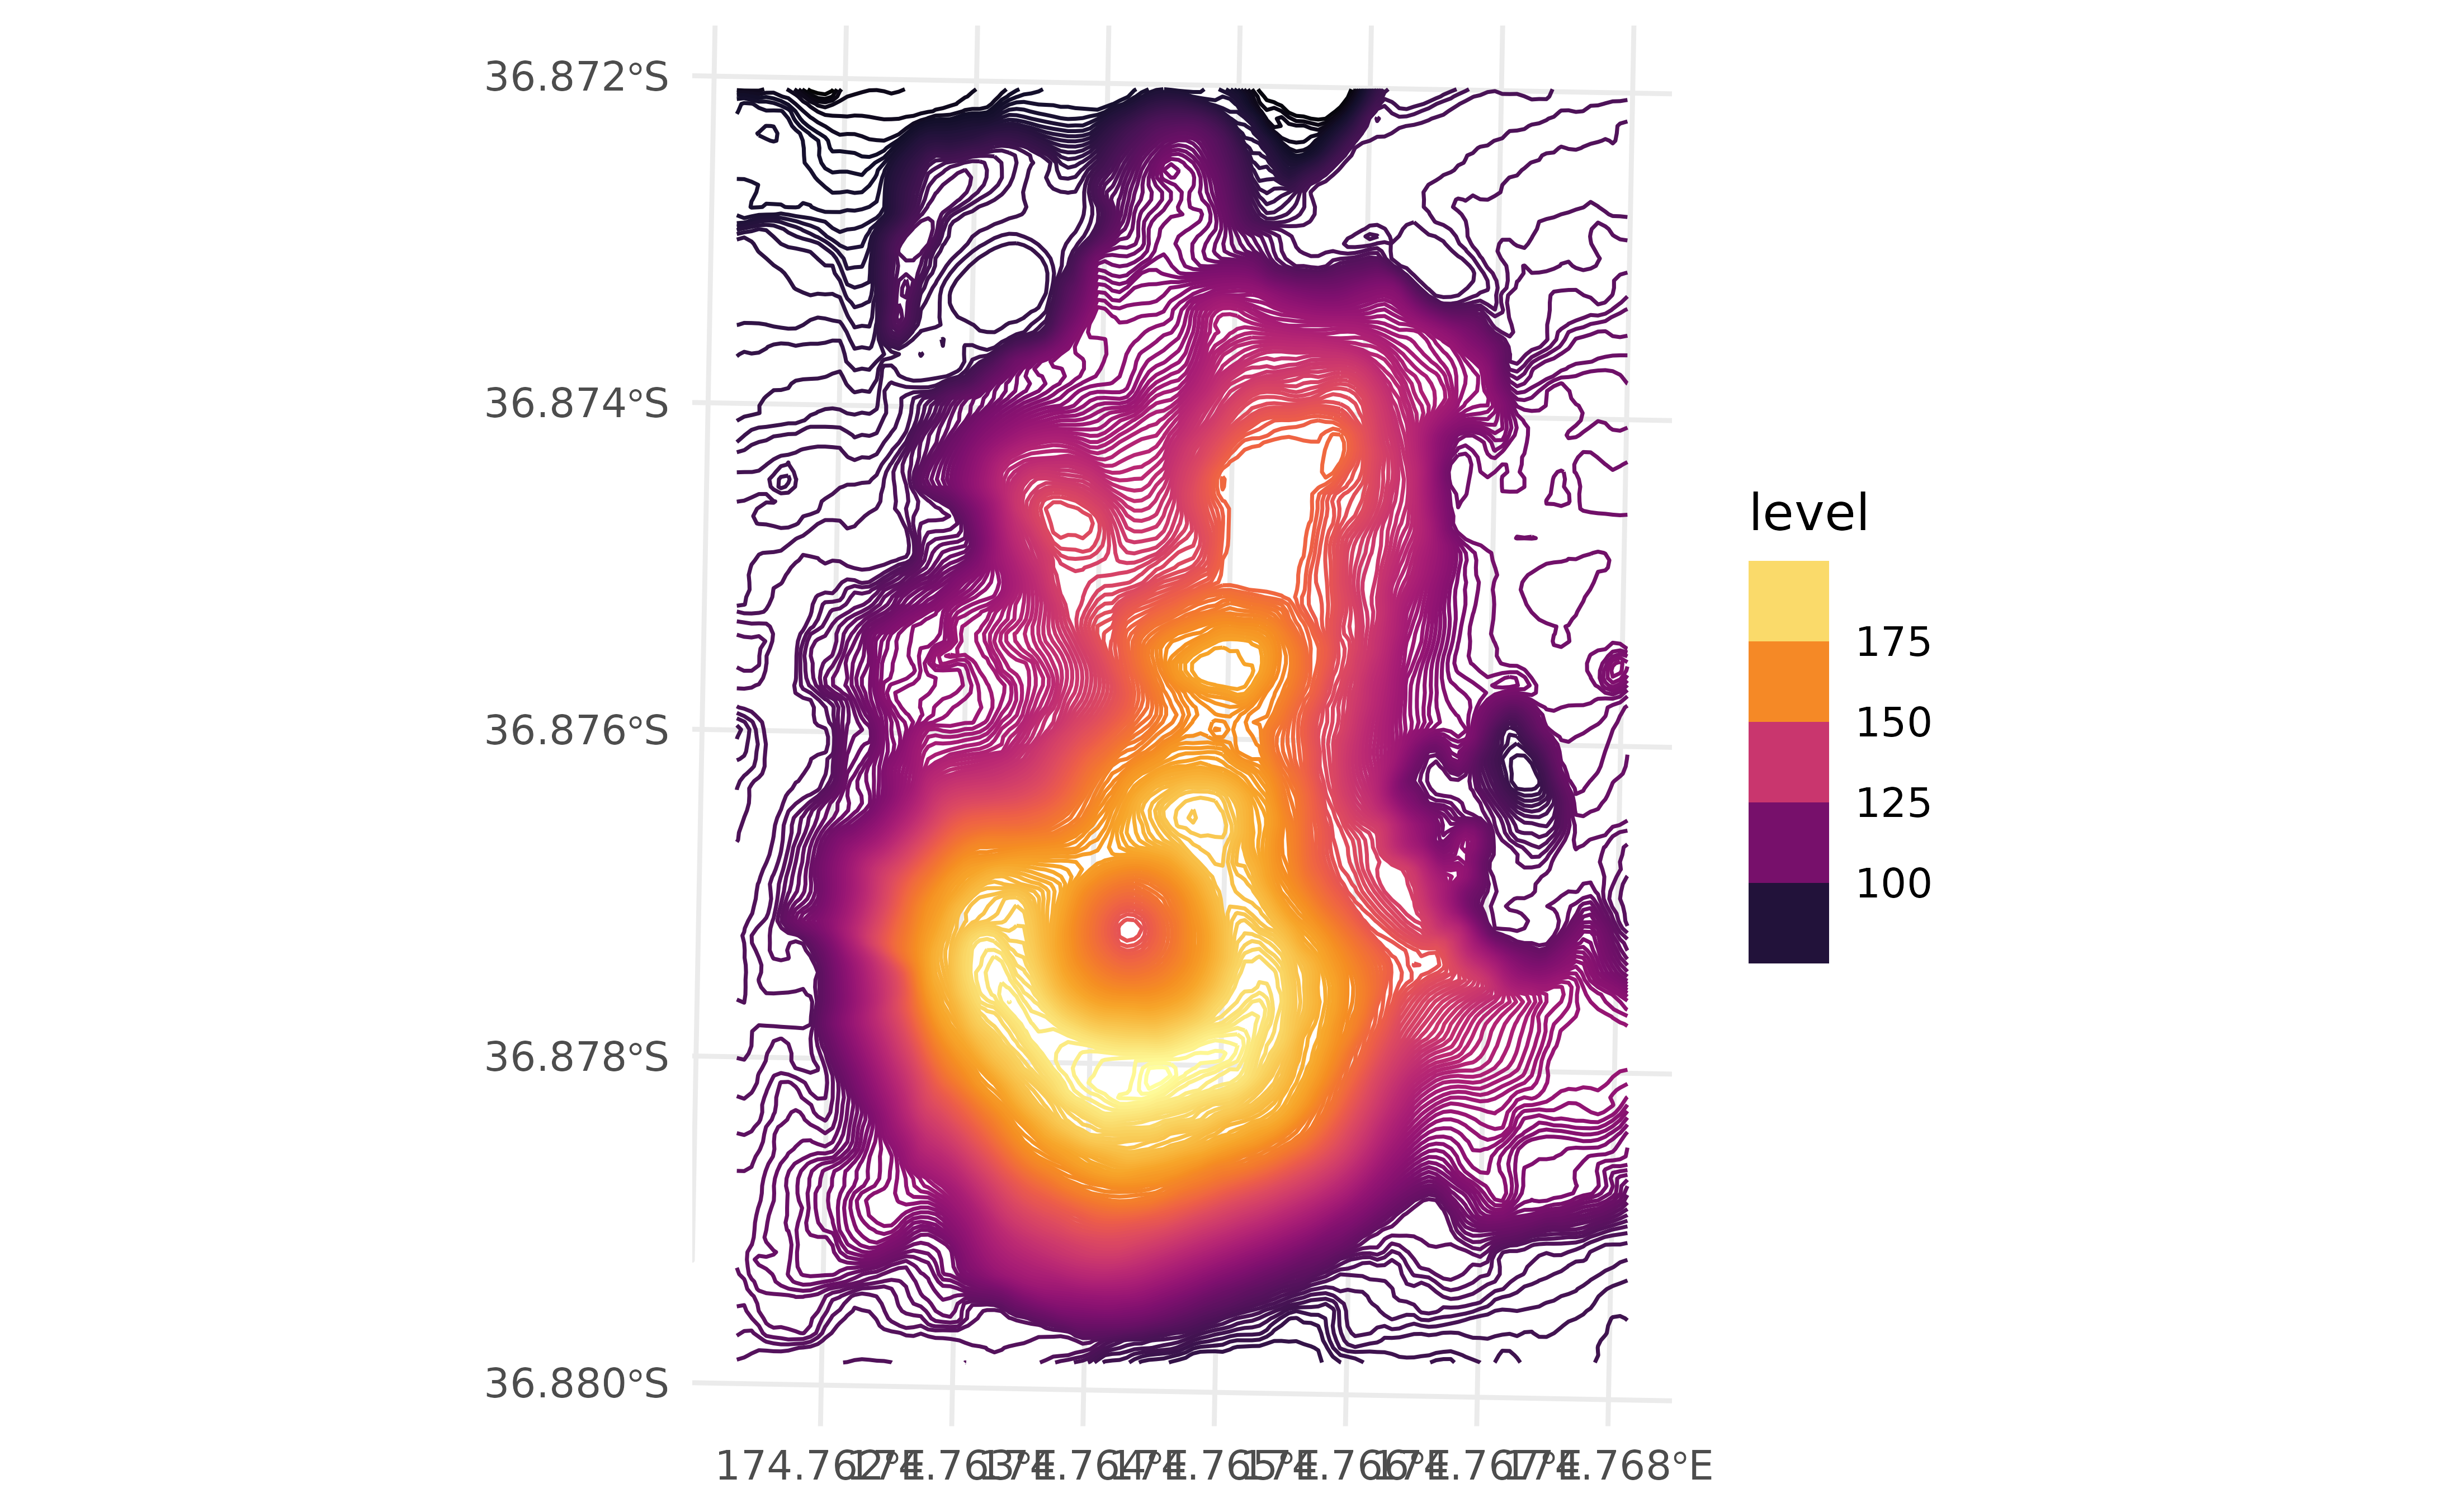
 ggplot() +
geom_spatraster_contour(
data = r, aes(color = after_stat(level)),
binwidth = 1,
linewidth = 0.4
) +
scale_color_gradientn(
colours = hcl.colors(20, "Inferno"),
guide = guide_coloursteps()
) +
theme_minimal()
ggplot() +
geom_spatraster_contour(
data = r, aes(color = after_stat(level)),
binwidth = 1,
linewidth = 0.4
) +
scale_color_gradientn(
colours = hcl.colors(20, "Inferno"),
guide = guide_coloursteps()
) +
theme_minimal()
 # Filled with breaks
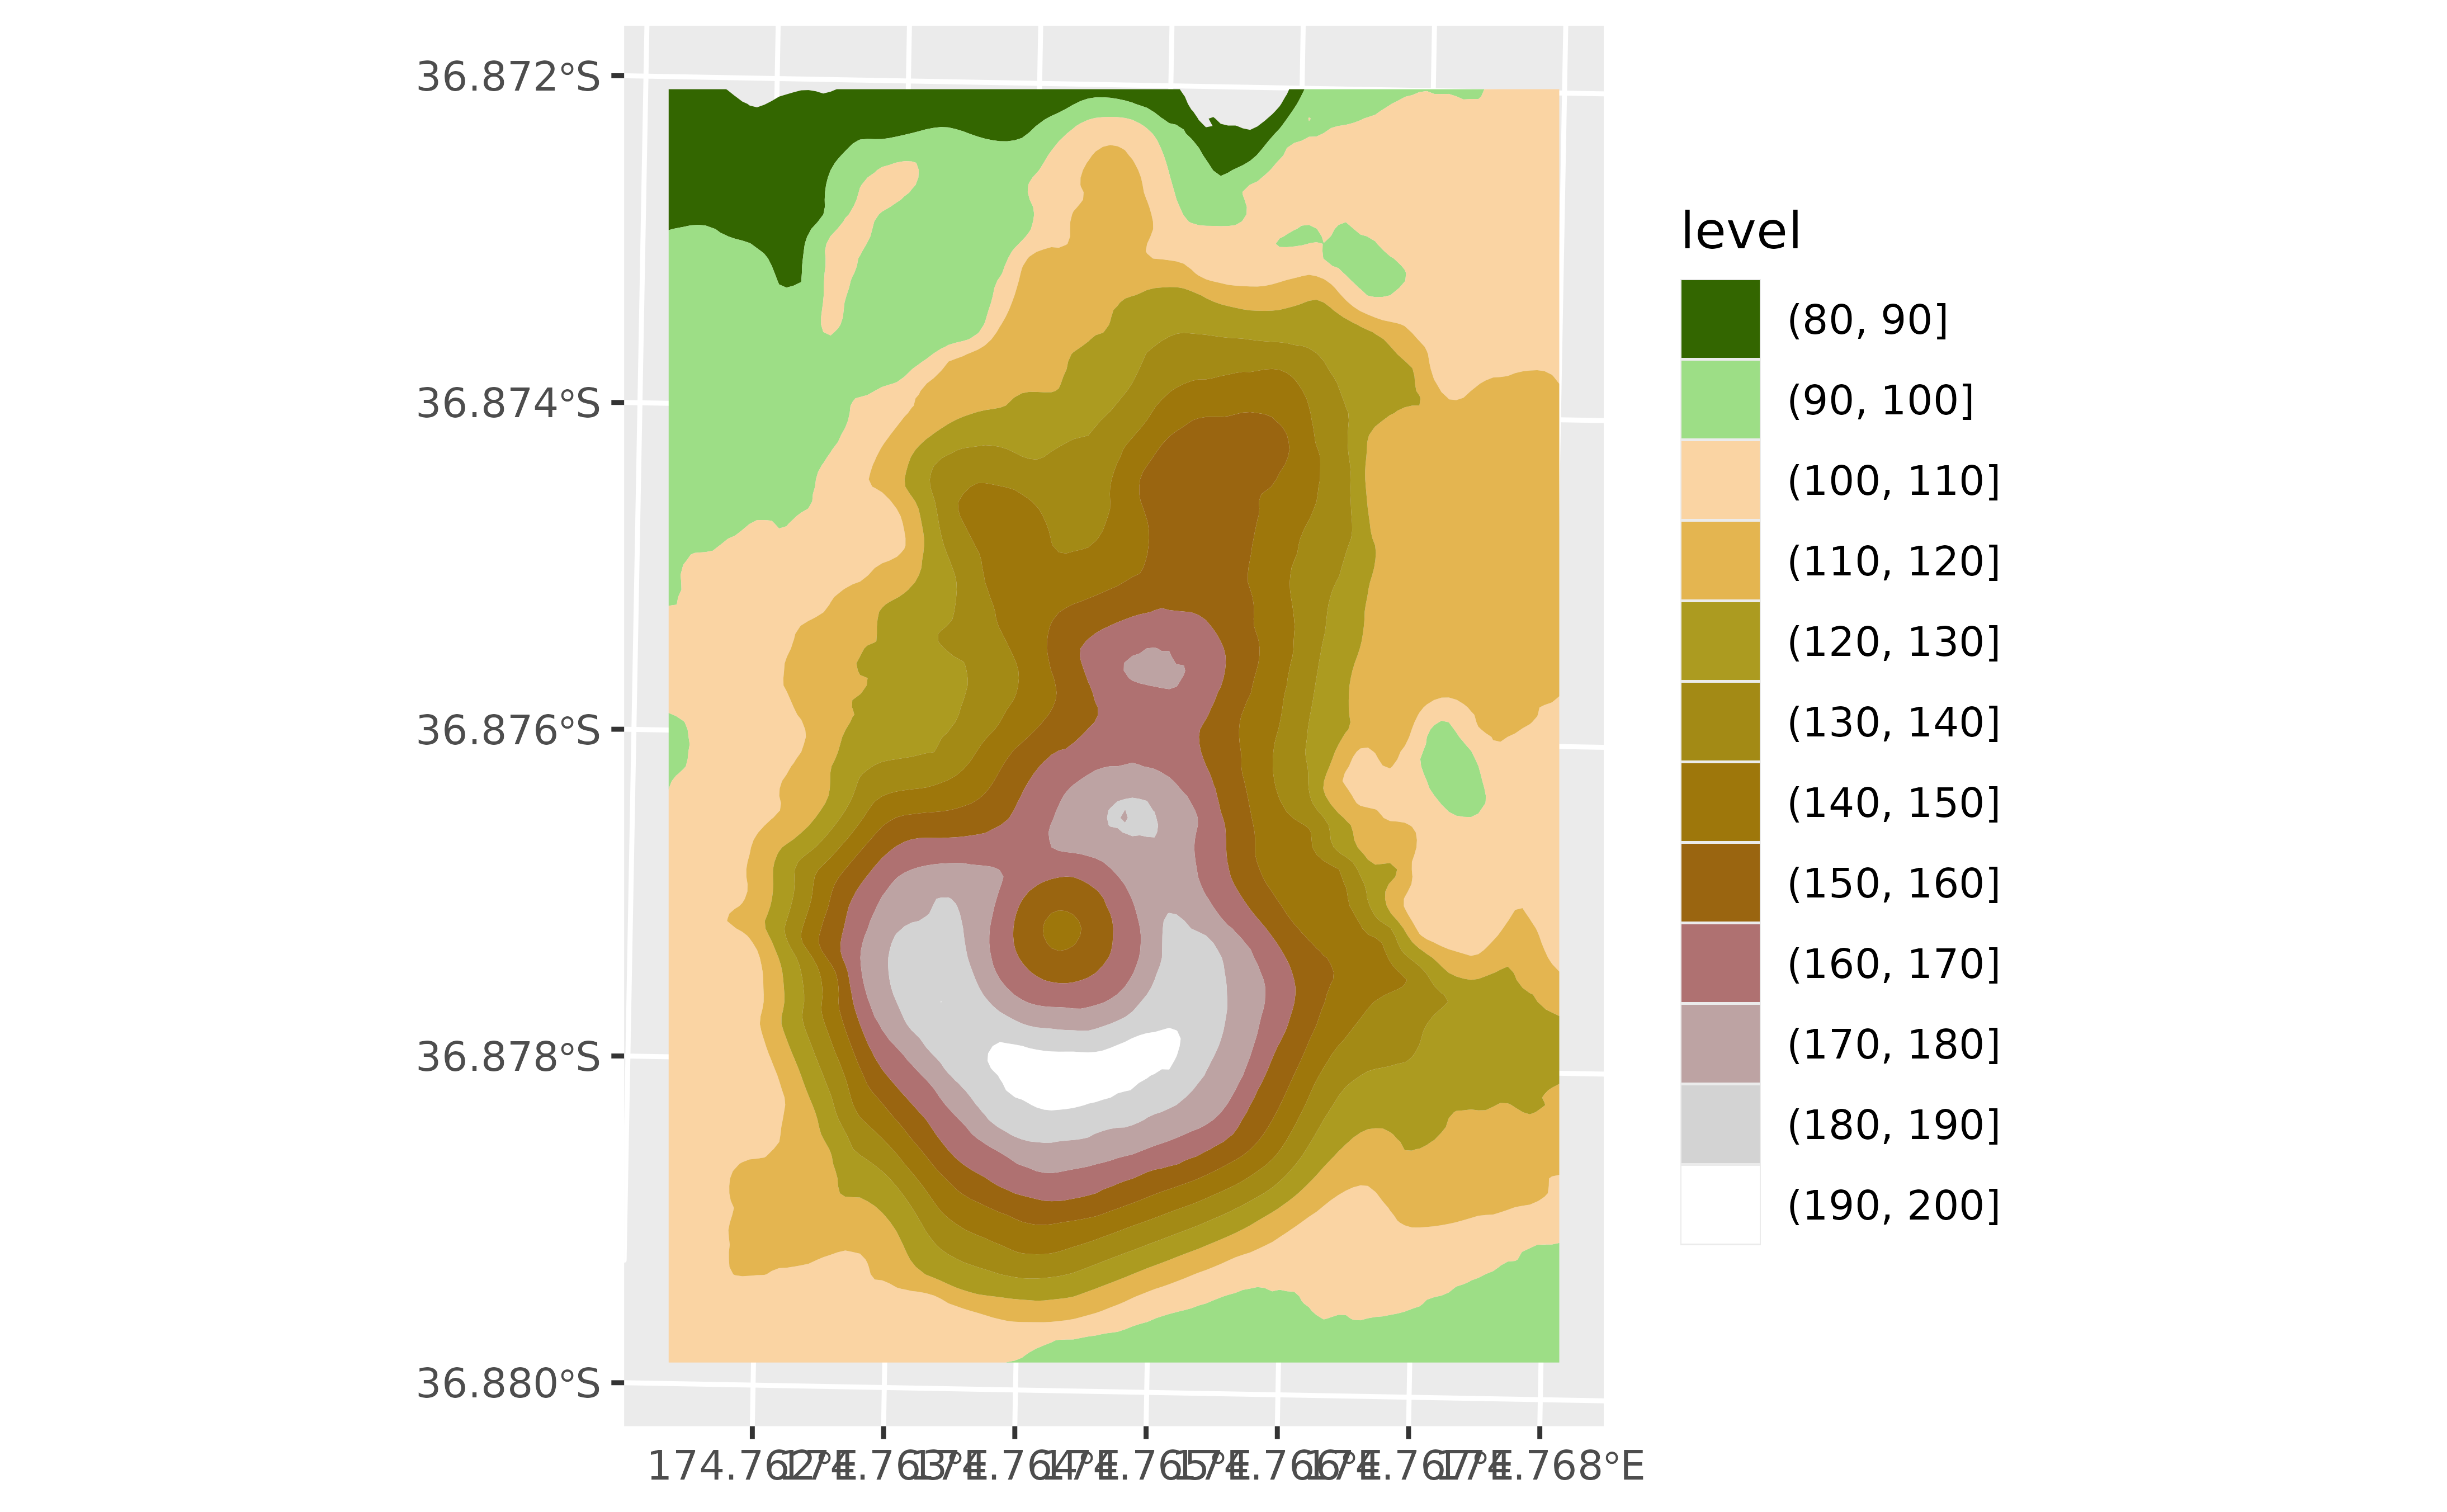
ggplot() +
geom_spatraster_contour_filled(data = r, breaks = seq(80, 200, 10)) +
scale_fill_hypso_d()
# Filled with breaks
ggplot() +
geom_spatraster_contour_filled(data = r, breaks = seq(80, 200, 10)) +
scale_fill_hypso_d()
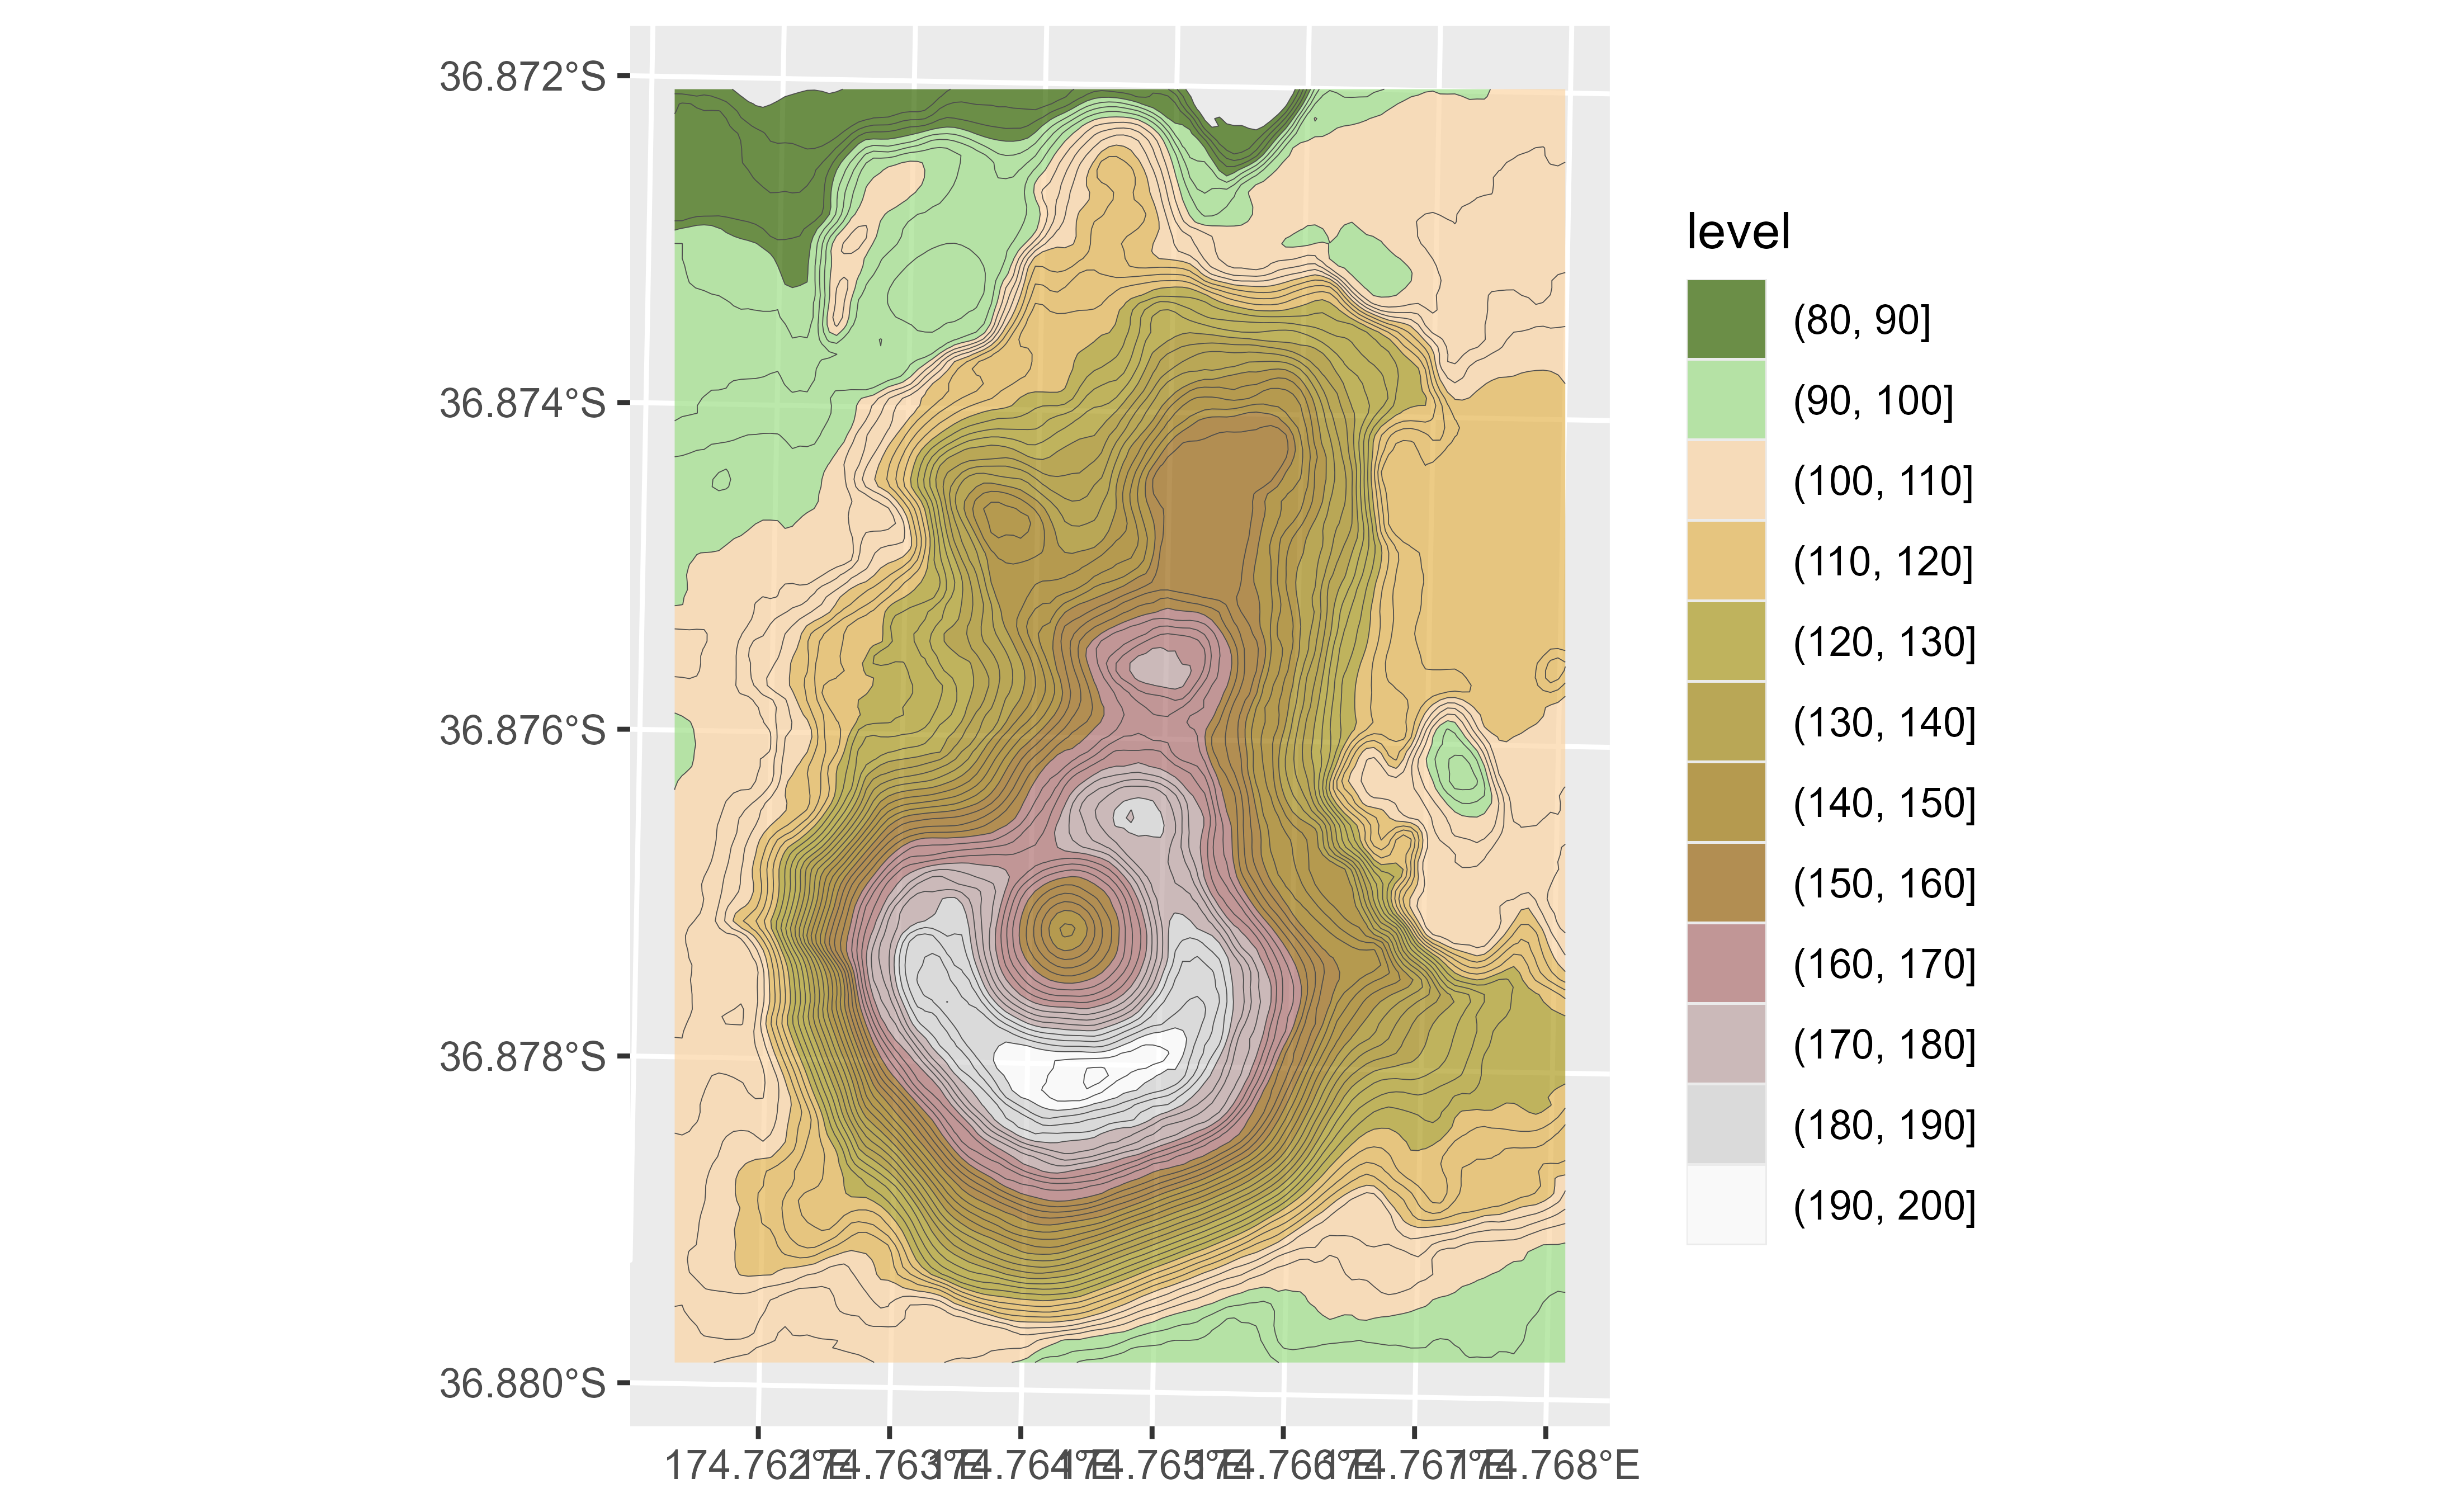
 # Both lines and contours
ggplot() +
geom_spatraster_contour_filled(
data = r, breaks = seq(80, 200, 10),
alpha = 0.7
) +
geom_spatraster_contour(
data = r, breaks = seq(80, 200, 2.5),
color = "grey30",
linewidth = 0.1
) +
scale_fill_hypso_d()
# Both lines and contours
ggplot() +
geom_spatraster_contour_filled(
data = r, breaks = seq(80, 200, 10),
alpha = 0.7
) +
geom_spatraster_contour(
data = r, breaks = seq(80, 200, 2.5),
color = "grey30",
linewidth = 0.1
) +
scale_fill_hypso_d()
 # }
# }